

Table of Contents
SAIL Share Price Target 2026, 2027, 2030
Company: Steel Authority of India Limited | NSE: SAIL | Analysis date: October 3, 2026
The SAIL share price target for 2026, 2027 and 2030 depends on the company’s ability to improve steel production, expand capacity, manage debt and sustain profit margins through the steel industry’s economic cycles.
MCX Gold Price Today | Gold Rate Today
Exide Share Price Target 2026, 2027, 2030
Tata Motors Share Price Target 2026, 2027, 2030
This statement summarizes the core fundamental drivers that long-term investors and equity analysts evaluate when projecting the valuation of the Steel Authority of India Ltd. (NSE:SAIL). Because steel is a deeply cyclical commodity, SAIL’s share price does not move in a straight line; rather, its long-term trajectories for 2026, 2027, and 2030 hinge on several structural pillars:
1. Capacity Expansion and Production (The 2030 Vision)
- The Goal: SAIL is currently in the midst of an aggressive modernization phase aiming to scale its total installed crude steelmaking capacity from ~20 million tonnes per annum (MTPA) to 35 MTPA by 2030.
- Impact on Share Price: Major capital expenditure projects—such as expanding the Bhilai Steel Plant to 10.2 MTPA and conducting brownfield expansions at the IISCO and Durgapur plants—require a capital outlay of nearly ₹1 lakh crore. Success in meeting these timelines directly dictates the 2030 target. If completed on schedule, the massive increase in volume will drive exponential revenue growth.
Block Deals NSE Today | Bulk Deal NSE
2. Debt Management and Capital Discipline
- The Balancing Act: Undertaking multi-billion dollar expansions usually strains a balance sheet. Historically, high debt levels during industry downcycles have depressed SAIL’s stock valuation.
- Recent Progress: SAIL has demonstrated strong financial prudence recently, drastically cutting its borrowings by over ₹8,000 crore during the 2025–2026 financial year and continuing to reduce debt into late 2026.
- Impact on Share Price: If SAIL can successfully fund a major portion of its ongoing capacity expansions through internal cash generation rather than excessive fresh borrowing, it will maintain a healthy debt-to-equity ratio. A lighter debt load lowers interest costs, protecting the company from financial distress when steel prices inevitably drop.
3. Sustaining Profit Margins & Shifting the Product Mix
- Input Costs & Efficiency: Steel manufacturing margins are highly vulnerable to volatile raw material costs (like coking coal) and fluctuating global steel prices.
- Value-Added Focus: To combat this, SAIL’s strategic priorities for 2026 and 2027 explicitly focus on enhancing its operational efficiencies, cost optimization, and raising the share of value-added and special steel products in its portfolio.
- Impact on Share Price: Special and processed steels command higher, more stable market prices than commercial-grade steel commodities. If SAIL successfully transitions to a higher-margin product mix, it cushions its bottom line against steep market drops, commanding a higher valuation multiple from investors.
4. Navigating Industry Economic Cycles
- Domestic Tailwinds: SAIL’s targets are heavily supported by strong domestic demand, as India’s ongoing infrastructure, construction, and automotive sectors continue to grow rapidly.
- Global Headwinds: Conversely, global volatility, oversupply from nations like China, or macro economic slowdowns present periodic downward pressures. Analysts’ target projections typically capture these cycles—modeling shorter-term volatility ranges for 2026/2027, while building broader bull-versus-bear case scenarios (ranging from ₹180 to ₹300+) by the 2030 milestone depending on where the global steel cycle sits.
This statement highlights a critical reality of investing in cyclical commodity markets: production volume does not equal profitability.
When analysts outline price targets for steel companies like Steel Authority of India Ltd. (NSE:SAIL) or Tata Steel (NSE:TATASTEEL), they are constructing “what-if” valuation scenarios rather than precise predictions. Here is a breakdown of why this distinction is vital for investors:
1. The Disconnect Between Volume and Revenue
In many industries (like technology or consumer goods), selling 10% more products almost always translates to higher revenues. In the steel industry, this relationship frequently breaks down.
- The Scenario: A steel plant might successfully expand capacity and grow its production volume by 15% year-over-year.
- The Reality: If global steel prices drop by 30% during that same period due to an economic slowdown or oversupply from China, the company’s total revenue will shrink, even though factories are running at record capacity.
2. Operating Leverage and Profit Margin Compression
Steel manufacturing requires massive fixed assets (blast furnaces, mining infrastructure, and heavy machinery). This results in high operating leverage, which cuts both ways:
- The Upside: When steel prices rise, profits grow exponentially because fixed costs remain the same while every extra dollar of revenue drops straight to the bottom line.
- The Downside: When steel prices fall, those fixed costs (maintenance, labor, interest on debt) do not change. As a result, even a minor dip in global steel prices can completely wipe out a company’s profit margins, turning a highly profitable year into a loss-making one despite high production volumes.
3. Volatility of Raw Materials (Input Costs)
Steel production relies heavily on raw inputs like coking coal and iron ore. Steel companies often cannot immediately pass sudden input cost spikes onto their consumers. If the price of coking coal doubles globally, a steelmaker’s cost of goods sold will soar. Even if they produce and sell more steel, their earnings (EBITDA) will shrink significantly due to compressed margins.
Summary
Valuation models for steel companies are highly sensitive to external variables—such as international trade policies, global demand trends, and raw material cycles—that the company cannot control. Therefore, price targets are merely mathematical outputs based on specific assumptions about commodity prices, not a guaranteed corporate roadmap.
SAIL Share Price Target 2026
The financial results provided for FY26 demonstrate that the Steel Authority of India Ltd. (NSE:SAIL) successfully executed a strategy focused on volume expansion, debt reduction, and operational recovery, establishing a solid foundation for its 2026 share price outlook.
Here is an elaboration on the key components driving this performance and the variables that lie ahead:
1. Robust Operational and Volume Growth
- Volume Gains outpace Production: While crude steel production ticked up moderately by 1.35% to 19.43 million tonnes, sales volume witnessed a substantial jump of 11.4% to 19.93 million tonnes. This indicates that SAIL successfully liquidated accumulated inventory and capitalized on strong domestic demand from India’s expanding infrastructure, construction, and automotive sectors.
- Top-line Growth: The surge in shipments directly translated into an 8.1% growth in revenue from operations, hitting ₹1,10,810 crore.
2. Operational Efficiencies and Explosive Profitability
- Margin Expansion: EBITDA grew by 11.7% to ₹13,146 crore, expanding faster than the top-line revenue growth. This signals that SAIL managed to improve its capacity utilization and implement operational cost-control measures.
- Profit Explosion: The most striking figure is the ~50.5% year-over-year growth in Profit After Tax (PAT). Because steel production carries high fixed overheads, small percentage increases in revenue and operating margins frequently trigger massive percentage growth in net profit—a concept known as positive operating leverage.
3. De-risking the Balance Sheet
- Aggressive Debt Reduction: SAIL cut its borrowings by ₹8,148 crore during the fiscal year. De-leveraging is highly valued by equity markets, especially for cyclical firms. Lower debt reduces interest expenses, directly protecting net profit margins during future industry downturns. It also frees up financial headroom for SAIL to fund its massive long-term capital expenditure goal of reaching 35 MTPA by 2030 without aggressively over-leveraging the balance sheet again.
4. Critical Headwinds and Ongoing Variables
Despite a stellar FY26, the outlook emphasizes that steel prices, raw-material costs, and operating margins remain key variables:
- The Commodity Pricing Risk: Steelmakers are “price takers”—they are highly vulnerable to volatile global steel prices dictated by international demand and manufacturing output (especially from China). A sharp drop in international steel prices can rapidly compress realized steel prices in India.
- Input Cost Volatility: SAIL relies heavily on imported coking coal. Sudden supply chain disruptions or global spikes in coking coal and iron ore costs can squeeze margins just as quickly as they expanded in FY26.
Summary: The FY26 numbers show a company performing at high operational efficiency and rapidly cleaning up its balance sheet. However, because it operates in a deeply cyclical sector, sustainable share price momentum through late 2026 relies on domestic economic demand remaining strong enough to absorb rising volumes while keeping international dumping or input-cost inflation at bay.
SAIL share price target 2026
Illustrative year-end scenario estimates
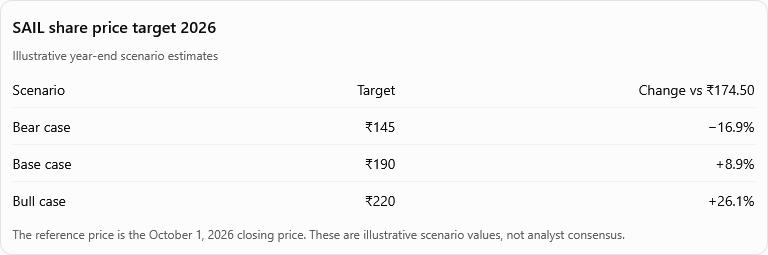
This table outlines three distinct valuation pathways for Steel Authority of India Ltd. (NSE:SAIL) through the end of 2026, calculated against its closing price of ₹174.50 on October 1, 2026. Because steel companies have highly volatile earnings driven by global market forces, these illustrative scenarios map out potential stock trajectories based on different operational and economic environments:
1. The Base Case (₹190 Target | +8.9% Upside)
- The Premise: This scenario represents the most statistically probable outcome if current macroeconomic and corporate trends remain stable.
- Underlying Assumptions: It assumes that the robust domestic demand from India’s infrastructure boom continues to absorb SAIL’s increased sales volumes. Operationally, it factors in the company sustaining the strong cost-control measures and margin improvements achieved during its recent financial year, all while avoiding major spikes in imported coking coal costs or a global drop in steel prices.
2. The Bull Case (₹220 Target | +26.1% Upside)
- The Premise: This represents an optimistic outlook where external economic factors align perfectly with SAIL’s internal growth initiatives.
- Underlying Assumptions: Achieving this target relies on a combination of stronger global steel realizations (potentially driven by production cuts or economic stimulus in China) and falling raw material costs. Higher profit margins, paired with further aggressive debt reduction, would likely prompt equity markets to expand SAIL’s valuation multiple (P/E or EV/EBITDA), driving rapid capital appreciation.
3. The Bear Case (₹145 Target | -16.9% Downside)
Underlying Assumptions: If international steel prices collapse or cheap steel imports begin dumping into the domestic Indian market, SAIL’s profit margins would face severe compression. Furthermore, a resurgence in input costs (like coking coal) or delays in its ongoing multi-billion dollar capacity expansions could trigger earnings downgrades, leading to a sharp market sell-off.
The Premise: This scenario outlines the downside risks inherent to investing in a deeply cyclical, fixed-cost-heavy commodity business.
SAIL Share Price Target 2027
Illustrative scenario estimates
| Scenario | Target | Change vs ₹174.50 |
|---|---|---|
| Bear case | ₹130 | −25.5% |
| Base case | ₹220 | +26.1% |
| Bull case | ₹285 | +63.3% |
The outlined scenarios for the 2027 outlook of Steel Authority of India Ltd. (NSE:SAIL) emphasize a wider variance in potential valuation compared to 2026. This widening gap between the bear and bull targets reflects the accumulating impact of long-term operational execution and cyclical commodity factors over a multi-year horizon.
Here is an elaboration on the strategic priorities management highlighted in mid-2026 and how they directly map to the 2027 valuation scenarios:
1. Shifting the Product Mix (The Margin Driver)
- Strategic Intent: SAIL is actively prioritizing an increased share of value-added and special steel products rather than relying purely on commercial-grade commodities.
- Impact on 2027 Valuation: Commodity-grade steel is highly vulnerable to international price wars and cheap imports. Conversely, specialized, value-added steel (like structural steels or customized grades for defense, railways, and automotive sectors) commands higher, sticky margins. Success here is the core engine behind the Bull Case (₹285 | +63.3%), as it structurally insulates SAIL’s bottom line, justifying a higher valuation multiple from the market.
2. Operational Cost Optimization and Modernization
- Strategic Intent: Modernizing aging steel infrastructure and optimizing operating costs are essential to lower the cost per tonne of steel produced.
- Impact on 2027 Valuation: Steel production involves high operating leverage. If SAIL can successfully streamline its logistics, energy consumption, and raw material utilization, its break-even point will lower. In the Base Case (₹220 | +26.1%), the market rewards gradual cost efficiencies and steady capacity ramp-ups with moderate earnings growth, even if global steel prices remain flat.
3. Financial Discipline & Capacity Expansion
- Strategic Intent: The company must walk a tightrope—continuing its multi-billion dollar capex expansions while simultaneously maintaining the financial discipline that allowed it to cut over ₹8,000 crore in debt during the previous fiscal year.
- Impact on 2027 Valuation: If execution slows down or capital expenditure overruns force the company to aggressively re-leverage its balance sheet, interest costs will eat into profits. A rising debt load paired with a potential macro slowdown forms the foundation of the Bear Case (₹130 | -25.5%), where the market would aggressively de-rate the stock due to compressed returns.
Summary of Scenarios
The 2027 price trajectory will ultimately serve as a report card on management’s June 2026 promises. If these internal efficiency metrics are achieved, SAIL can realize substantial upside even during an average economic environment; if global headwinds hit while internal cost structures remain unoptimized, substantial downside risk remains.
SAIL Share Price Target 2030
Illustrative long-term scenarios
| Scenario | Target | Change vs ₹174.50 |
|---|---|---|
| Bear case | ₹180 | +3.2% |
| Base case | ₹360 | +106.3% |
| Bull case | ₹520 | +198.0% |
The long-term outlook for Steel Authority of India Ltd. (NSE:SAIL) highlights that its 2030 valuation is inextricably linked to structural capacity expansion and macro-driven demand, rather than short-term price fluctuations. By modeling a horizon up to 2030, analysts look past minor commodity cycles to evaluate the company’s ultimate scale.
Here is an elaboration on the operational drivers and the illustrative long-term valuation scenarios outlined:
1. The 35 MTPA Expansion Mandate (The Volume Engine)
- The Strategic Goal: As outlined in its FY26 annual report, SAIL aims to nearly double its crude steel capacity from ~20 million tonnes per annum (MTPA) to 35 MTPA by the fiscal year 2031. This massive brownfield and greenfield expansion spans major hubs including IISCO, Durgapur, Bokaro, Rourkela, and Bhilai.
- Current Operational Traction: August 2026 data confirms this expansion mindset is already bearing fruit. Crude steel production rose 8% year-over-year to 1.68 million tonnes for the month, while total sales jumped 13% to 1.871 million tonnes. More importantly, cash collections surged 23%, allowing SAIL to slash its borrowings by an additional ₹870 crore in just a few months following March 2026.
2. Deconstruction of the 2030 Illustrative Scenarios
Because forecasting a cyclical stock multiple years into the future carries high uncertainty, the outcomes vary drastically based on project execution and global economic health:
- The Base Case (₹360 Target | +106.3% Upside): This scenario assumes India’s domestic steel consumption continues to grow steadily, fueled by national infrastructure pipelines. It builds on the assumption that SAIL successfully ramps up its facilities on time, steadily expands its higher-margin value-added steel portfolio, and maintains the financial discipline needed to keep debt under control.
- The Bull Case (₹520 Target | +198.0% Upside): For the stock to nearly triple by 2030, internal execution must perfectly align with an extended global structural uptrend in steel prices. In this environment, SAIL would achieve maximum capacity utilization across its modernized plants, generate massive free cash flow, and fully fund its expansion internally—prompting a substantial re-rating of its equity valuation.
- The Bear Case (₹180 Target | +3.2% Upside): This floor scenario demonstrates what happens if the multi-billion dollar capex plans suffer from severe structural delays, bureaucratic bottlenecks, or cost overruns. If SAIL faces higher raw material costs or global economic stagnation while carrying heavy expansion debt, earnings growth would stall, causing the stock to trade flat against its late-2026 baseline.
SAIL Share Price Target 2026, 2027, 2030: Bull vs Base vs Bear
SAIL share price target summary
All figures in ₹ per share
| Year | Bear case | Base case | Bull case |
|---|---|---|---|
| 2026 | 145 | 190 | 220 |
| 2027 | 130 | 220 | 285 |
| 2030 | 180 | 360 | 520 |
Illustrative scenario assumptions, not official targets or verified market consensus.
A foundational rule of financial modeling for cyclical companies: time increases both the potential upside and the severity of risk.
When dealing with a commodity-driven business like Steel Authority of India Ltd. (NSE:SAIL), long-term valuation scenarios widen over time because external cycles and internal execution errors compound. Here is an elaboration on why the scenarios diverge this way:
1. The Compounding Effect of Downcycles (Why the 2027 Bear Case is Lower Than 2026)
- The Factor of Time: A downturn in the steel sector is rarely a single-quarter event. If global steel demand weakens or international dumping intensifies in late 2026, a company might survive the first few months on backorders and cash reserves.
- The Long-Term Damage: By 2027, a prolonged downcycle means prolonged margin compression. If realized steel prices stay low for over a year, the company’s cash generation dries up while its high fixed operational overheads remain unchanged.
- Debt and CapEx Strain: Over time, weak earnings force a company to either halt its modernization projects or borrow fresh capital to fund them. This accumulation of financial strain over multiple quarters explains why the 2027 bear case (₹130) drops below the 2026 bear case (₹145); the market aggressively punishes prolonged asset underutilization and balance sheet deterioration.
2. Divergent Earnings Growth Paths (Base vs. Bull Cases)
The positive paths assume that SAIL avoids an economic downturn, but they differ significantly on internal execution and industry tailwinds:
- The Base Case Path: This assumes steady, organic progression. The company successfully implements its planned capacity expansions on time, and India’s infrastructure push absorbs the extra volume. Earnings grow at a stable pace, and the market applies a conservative, historical valuation multiple to those earnings.
- The Bull Case Path: This path requires everything to align perfectly. It assumes that not only do production volumes scale up, but global steel prices also rise structurally. Simultaneously, a sharp increase in value-added special steel sales drives explosive operating profit expansion. The market rewards this high-margin efficiency by expansion of the valuation multiple itself (e.g., a higher P/E or EV/EBITDA multiple), causing a dramatic rise in share valuation.
Summary
Ultimately, these long-term models serve as stress tests. They show that while short-term targets (2026) stay anchored near the current baseline, extending the horizon to 2027 and 2030 allows different macro environments to completely reshape the company’s financial profile.
How We Calculated the SAIL Share Price Target
The primary valuation framework is the forward price-to-earnings (P/E) method:
Estimated EPS × Assumed P/E = Illustrative share price
The following EPS and P/E values are model assumptions for explaining the scenarios. They are not company guidance or analyst consensus.
| Financial year | Bear EPS | Base EPS | Bull EPS |
|---|---|---|---|
| FY27 | ₹11 | ₹14 | ₹16 |
| FY28 | ₹10 | ₹16 | ₹19 |
| FY29 | ₹11 | ₹19 | ₹23 |
| FY30 | ₹12 | ₹24 | ₹32 |
The calculations for the base case are:
| Target year | EPS assumption | P/E assumption | Calculated target |
|---|---|---|---|
| 2026 | ₹14 | 13.57 | ₹190 |
| 2027 | ₹16 | 13.75 | ₹220 |
| 2030 | ₹24 | 15.00 | ₹360 |
The valuation multiples are illustrative. The 2030 base case assumes a modest valuation premium relative to the shorter-term base cases, reflecting the possibility of improved earnings visibility as capacity expansion progresses. That premium is not assured.
The bear and bull scenarios use different combinations of earnings and P/E assumptions to account for changes in operating performance and investor expectations.
Valuation limitation: A full comparison of SAIL’s current P/E, forward P/E, P/B, EV/EBITDA, historical valuation range and steel-sector peer multiples has not been independently established from a consistent set of verified October 2026 financial data here. The illustrative multiples should therefore not be mistaken for a conclusion that SAIL is undervalued or overvalued.
Key Factors That Could Drive SAIL Share Price
This comprehensive breakdown outlines the fundamental levers that will determine the investment thesis and valuation of the Steel Authority of India Ltd. (NSE:SAIL) through the late 2020s.
Here is an in-depth elaboration on how these six key drivers interconnect to shape SAIL’s financial trajectory:
1. Capacity Expansion vs. Capital Risk
- The Scale: Transitioning from ~20 MTPA to 35 MTPA by FY31 is one of the largest industrial expansions in the Indian public sector. Successful implementation guarantees that SAIL remains a dominant player in India’s industrial landscape.
- The Reality Check: Large-scale engineering projects are notorious for bureaucratic delays, supply chain bottlenecks, and cost overruns. If the commissioning schedules slip, SAIL risks locking up capital in “work-in-progress” assets that drain cash instead of generating revenue.
2. India’s Macro Tailwinds (Infrastructure Engine)
- The Domestic Core: Unlike global competitors who rely heavily on exports, SAIL’s growth is heavily tied to domestic nation-building. The August 2026 data highlighting a surge in long rail supplies to Indian Railways underscores this structural link.
- The Shield: Strong state-backed demand for infrastructure, urban housing, and high-speed rail corridors shields SAIL from global commodity slumps, ensuring a consistent consumer base for its rising production volumes.
3. Maintaining the EBITDA Margin Floor
- Operational Performance: Moving from an EBITDA of ₹11,764 crore in FY25 to ₹13,146 crore in FY26, alongside a healthy Q1 FY27 EBITDA margin of ~16.7%, proves that SAIL is currently highly efficient.
- The Necessity: This 16.7% operational cushion is not just a metric for current profits; it is the financial engine needed to fund the upcoming multi-billion dollar expansions. If margins slip due to cost inflation, SAIL will be forced to stall its growth plans.
4. The Balance Sheet Walking Tour (Debt Reduction)
- De-leveraging Success: Dropping borrowings by ₹8,148 crore in FY26 and maintaining that momentum with an extra ₹870 crore reduction by August 2026 has fundamentally de-risked the company.
- The Paradox: While lower debt reduces interest payments and expands financial flexibility, the 35 MTPA expansion roadmap will require immense future capital layout. The main financial challenge for SAIL through 2030 will be balancing ongoing capital expenditure without reversing these debt-reduction gains.
5. Transition to Value-Added Steel
- Breaking the Commodity Cycle: Commodity-grade steel prices are completely volatile, changing on global supply shifts. Moving into value-added and special steels allows SAIL to command premium, highly stable prices.
- The Competitive Hurdle: This space is highly contested by nimble domestic private giants like Tata Steel (NSE:TATASTEEL) and JSW Steel (NSE:JSWSTEEL), alongside international imports. SAIL must prove its manufacturing efficiency can match or undercut these competitors to successfully capture market share.
6. Institutional Ownership as a Market Gauge
The Holistic View: Institutional accumulation typically signals confidence that SAIL is balancing its debt, hitting its expansion timelines, and maintaining stable margins. Conversely, sharp institutional exits are often the first indicator of cyclical economic downturns or operational slowdowns.
The Institutional Signal: Inflows and outflows from Foreign Institutional Investors (FIIs) and Domestic Institutional Investors (DIIs) serve as a running market consensus on SAIL’s execution.
Risks to the SAIL Share Price Target
Investing in a state-owned, heavy-commodity giant like the Steel Authority of India Ltd. (NSE:SAIL) involves navigating multiple layers of operational, financial, and macroeconomic risks. Because steel manufacturing is capital-intensive and highly sensitive to economic cycles, any projection of its share price through 2026, 2027, or 2030 must factor in the following vulnerabilities:
1. Volatility in Pricing and Product Cycles
- Steel Price Volatility: SAIL acts as a “price taker” in global markets. If international steel demand declines—or if global supply increases significantly—realized domestic steel prices will drop, compressing margins regardless of the company’s production volumes.
- Industry Cyclicality: The steel industry is directly tied to construction, infrastructure, and automotive cycles. Economic slowdowns or tighter monetary policies can reduce consumption across these core industries.
- Competition and Imports: SAIL faces ongoing competition from efficient private domestic giants like JSW Steel (NSE:JSWSTEEL) and Tata Steel (NSE:TATASTEEL), as well as the constant threat of lower-priced steel imports being dumped into the domestic Indian market.
2. Squeezed Operational Profitability (Input Costs)
- Raw-Material and Energy Costs: While SAIL possesses captive iron ore mines, it remains highly vulnerable to the volatile international prices of imported coking coal. Sudden spikes in coking coal, electricity tariffs, or rail freight rates can substantially increase the cost per tonne of steel produced, lowering net margins.
- Regulatory and Environmental Costs: Compliance with evolving carbon emission targets, environmental mandates, and domestic mining lease regulations can require unanticipated capital outlays, driving up operational costs over time.
3. Capital Misallocation and Balance Sheet Pressure
- Expansion Execution Risks: SAIL’s long-term targets rely heavily on its massive strategic initiative to scale crude steel production capacity to 35 MTPA by FY31. Large industrial projects face inherent risks of bureaucratic delays, engineering faults, or slow commissioning schedules, which can delay revenue generation.
- Capital Expenditure (CapEx) Strain: Funding a multi-billion dollar modernization program requires massive cash outlays. Even though SAIL successfully reduced its borrowings through late 2026, prolonged high-intensity CapEx can drain free cash flows and force the company to accumulate debt, leaving it financially exposed if an industry downcycle occurs concurrently.
4. Valuation Multiple Contraction
- Valuation Risk: A company’s share price is a function of its earnings multiplied by its market valuation multiple (such as the Price-to-Earnings or EV/EBITDA ratio). During sector-wide downturns or periods of risk-averse institutional sentiment, equity markets often compress these valuation multiples. Consequently, even if SAIL grows its underlying net profits, a declining multiple can cancel out those fundamental gains and keep the stock price flat or depressed.
Is SAIL a Long-Term Growth Story?
The question of whether the Steel Authority of India Ltd. (NSE:SAIL) represents a structural long-term growth story requires balancing its fundamental operational turnaround with the harsh economic realities of the steel industry’s cyclical nature.
Here is an analytical breakdown of how these opposing forces interact to shape SAIL’s investment case:
1. The Bull Case: The Foundation for Structural Growth
SAIL’s fundamental narrative is built on several pillars that differentiate it from international peers:
- Secular Domestic Demand: SAIL is a primary beneficiary of India’s long-term nation-building phase. Massive structural spending on urban infrastructure, industrial corridors, and the expansion of Indian Railways provides an insulated, expanding market for its products.
- Operational Turning Point: The company’s recent track record proves it can translate macro demand into tangible financial results. The surge in top-line revenue and a 50.5% explosion in net profit during FY26 highlight strong execution.
- Prudent Capital Allocation: Historically, state-owned steelmakers have suffered from over-leveraged balance sheets during economic slumps. By wiping out over ₹8,000 crore in debt during FY26 and maintaining that discipline into late 2026, SAIL has cleared out crucial financial headwind before embarking on its next capital phase.
2. The Multi-Year Catalyst: The 35 MTPA Roadmap
The central driver behind any long-term valuation model for SAIL is its goal to scale crude steel capacity to 35 MTPA by FY31. If executed successfully, this modernization program will double the company’s volume capabilities over the next five years. Early data, such as the August 2026 operating update showing an 8% increase in crude steel production, suggests that initial brownfield expansion phases are moving forward smoothly.
3. The Counter-Argument: The Risks Hidden in the Scale
Despite clear operational strengths, evaluating SAIL purely through volume targets is dangerous. A true growth stock must consistently generate a return on capital employed (ROCE) that exceeds its cost of capital. For SAIL, this depends on several moving variables:
- The Return Profile of Capital Expenditure: Spending massive amounts of money to add factories can destroy shareholder value if global pricing power erodes. If global steel supply imbalances suppress domestic steel prices, SAIL’s newly built capacity will fail to generate adequate financial returns.
- The Debt Re-Leveraging Trap: While cash flow collection growth (up 23% in August 2026) has kept debt low so far, the intense financial demands of a 35 MTPA expansion could force SAIL to aggressively borrow capital again over the 2027–2030 horizon.
- The Valuation Ceiling: As a cyclical public-sector enterprise, equity markets naturally restrict SAIL to lower Price-to-Earnings (P/E) multiples than those assigned to asset-light, non-cyclical industries. Capital appreciation relies on the company continuously scaling its higher-margin value-added special steel products to fundamentally change its market rating.
Conclusion
SAIL is a long-term growth story regarding pure physical scale and strategic value to India’s economy. However, for equity investors, it remains a cyclical growth story. Its ultimate success through 2030 will not be judged by how many tonnes of steel it can manufacture, but by its operational efficiency in protecting its ~16.7% EBITDA margins and preventing balance sheet strain when global commodity headwinds inevitably hit.
Frequently Asked Questions
1. What is SAIL share price target for 2026?
The illustrative SAIL share price targets for 2026 are ₹145 in the bear case, ₹190 in the base case and ₹220 in the bull case. These scenarios use assumed earnings and valuation multiples and are not guaranteed price predictions.
2. What is SAIL share price target for 2027?
The illustrative SAIL share price target for 2027 is ₹220 in the base case, with a bear-case estimate of ₹130 and a bull-case estimate of ₹285. These figures depend on earnings growth, steel prices and valuation assumptions.
3. What is SAIL share price target for 2030?
The illustrative SAIL share price target for 2030 is ₹360 in the base case. The bear and bull scenarios are ₹180 and ₹520, respectively. The long-term estimates depend heavily on capacity expansion, profitability and the steel industry’s economic conditions.
4. What factors could affect SAIL share price?
SAIL’s share price could be affected by steel prices, production volumes, EBITDA margins, raw-material costs, infrastructure demand, capacity expansion, debt levels, competition and changes in market valuation.
5. What valuation method is used for the SAIL share price target?
The primary method used in this analysis is forward P/E valuation. It multiplies an assumed future EPS by an illustrative P/E multiple. The estimates are scenario-based and are not official company forecasts or analyst consensus targets.
6. What are the major risks to the SAIL share price target?
The major risks include steel price volatility, margin pressure, higher raw-material costs, expansion delays, capital expenditure requirements, competition, regulatory changes and a possible decline in valuation multiples.
Source Quality Report
| Information | Source | Source type | Date | Verified |
|---|---|---|---|---|
| FY26 financial results | SAIL official FY26 results | Primary | May 15, 2026 | Yes |
| Q1 FY27 results | SAIL official Q1 results | Primary | July 24, 2026 | Yes |
| Capacity expansion | Ministry of Steel annual report | Government report | FY26 | Yes |
| August 2026 production and sales | SAIL August 2026 update | Primary | September 4, 2026 | Yes |
| Share price | SAIL historical share price | Secondary market-data source | October 1, 2026 | Yes |
| EPS projections and price targets | Scenario calculations in this article | Model assumptions | October 3, 2026 | Illustrative only |
| Comprehensive peer and historical valuation comparison | Consistent, verified dataset not established | Not verified | October 3, 2026 | No |
Disclaimer: These share price targets are scenario-based estimates for educational and informational purposes only. They are not guaranteed price predictions or investment advice. Actual prices may differ materially depending on earnings, valuation, market conditions and company-specific developments.
SAIL Share Price History (Oct 2026)
| Date | Closing Price | Open | High | Low | Volume | Change % |
|---|---|---|---|---|---|---|
| 07-10-2026 | 174.31 | 176.72 | 177.35 | 173.62 | 8.86M | -2.13% |
| 06-10-2026 | 178.10 | 177.30 | 180.45 | 174.80 | 19.43M | 0.65% |
| 05-10-2026 | 176.95 | 174.21 | 180.44 | 173.28 | 11.41M | 1.40% |
| 01-10-2026 | 174.50 | 180.50 | 181.67 | 170.67 | 26.21M | -3.85% |
SAIL Share Price History (Sept 2026)
| Date | Closing Price | Open | High | Low | Volume | Change % |
| 30-09-2026 | 181.49 | 181.85 | 186.00 | 180.26 | 15.65M | -0.18% |
| 29-09-2026 | 181.82 | 182.53 | 186.86 | 181.21 | 21.24M | -1.29% |
| 28-09-2026 | 184.20 | 185.71 | 188.22 | 182.76 | 14.31M | -0.43% |
| 25-09-2026 | 185.00 | 184.64 | 186.05 | 182.77 | 9.68M | 0.54% |
| 24-09-2026 | 184.00 | 182.70 | 191.36 | 182.15 | 24.82M | -0.78% |
| 23-09-2026 | 185.44 | 174.50 | 185.70 | 174.50 | 41.62M | 6.57% |
| 22-09-2026 | 174.01 | 177.10 | 178.29 | 174.00 | 7.07M | -1.86% |
| 21-09-2026 | 177.30 | 178.00 | 179.80 | 175.10 | 7.04M | -0.02% |
| 18-09-2026 | 177.33 | 176.50 | 179.80 | 176.03 | 11.88M | 1.33% |
| 17-09-2026 | 175.01 | 173.00 | 176.25 | 173.00 | 11.25M | 0.84% |
| 16-09-2026 | 173.55 | 173.79 | 174.90 | 170.50 | 9.87M | 0.32% |
| 15-09-2026 | 173.00 | 179.53 | 180.00 | 172.92 | 10.22M | -3.35% |
| 11-09-2026 | 179.00 | 182.43 | 182.43 | 178.65 | 8.76M | -2.59% |
| 10-09-2026 | 183.75 | 186.51 | 187.03 | 183.10 | 8.06M | -1.42% |
| 09-09-2026 | 186.40 | 185.98 | 189.40 | 185.36 | 13.77M | 0.16% |
| 08-09-2026 | 186.10 | 188.50 | 190.80 | 186.05 | 19.25M | -0.96% |
| 07-09-2026 | 187.90 | 196.99 | 196.99 | 187.30 | 32.63M | -4.52% |
| 04-09-2026 | 196.80 | 197.86 | 200.10 | 194.30 | 19.09M | -0.10% |
| 03-09-2026 | 197.00 | 196.50 | 200.04 | 194.26 | 17.72M | 0.25% |
| 02-09-2026 | 196.50 | 192.21 | 198.39 | 190.27 | 19.46M | 1.81% |
| 01-09-2026 | 193.00 | 196.00 | 200.80 | 190.25 | 29.12M | -1.03% |
SAIL Share Price History (Aug 2026)
| Date | Closing Price | Open | High | Low | Volume | Change % |
| 31-08-2026 | 195.00 | 198.10 | 200.39 | 195.00 | 22.06M | -2.50% |
| 28-08-2026 | 200.00 | 193.05 | 200.96 | 192.55 | 48.59M | 3.63% |
| 27-08-2026 | 193.00 | 193.90 | 195.90 | 187.50 | 41.84M | -0.97% |
| 26-08-2026 | 194.90 | 185.95 | 196.50 | 182.40 | 44.55M | 5.59% |
| 25-08-2026 | 184.59 | 180.70 | 186.89 | 180.30 | 68.91M | 2.75% |
| 24-08-2026 | 179.65 | 174.80 | 180.96 | 174.71 | 48.23M | 3.57% |
| 21-08-2026 | 173.46 | 174.90 | 177.00 | 173.02 | 14.69M | -0.82% |
| 20-08-2026 | 174.90 | 174.10 | 176.43 | 173.41 | 14.06M | 1.24% |
| 19-08-2026 | 172.75 | 169.90 | 173.95 | 169.32 | 10.69M | 1.50% |
| 18-08-2026 | 170.20 | 173.50 | 174.67 | 169.86 | 11.05M | -1.96% |
| 17-08-2026 | 173.60 | 168.61 | 174.30 | 168.11 | 10.85M | 2.41% |
| 14-08-2026 | 169.51 | 167.99 | 171.60 | 158.73 | 28.04M | 0.49% |
| 13-08-2026 | 168.68 | 173.70 | 173.99 | 167.25 | 9.64M | -3.06% |
| 12-08-2026 | 174.00 | 172.69 | 175.90 | 171.16 | 18.94M | 0.58% |
| 11-08-2026 | 173.00 | 171.50 | 173.45 | 169.32 | 13.26M | 0.32% |
| 10-08-2026 | 172.45 | 177.00 | 180.11 | 168.46 | 28.75M | -2.34% |
| 07-08-2026 | 176.58 | 176.60 | 176.88 | 174.61 | 9.57M | -0.09% |
| 06-08-2026 | 176.74 | 176.21 | 179.75 | 174.87 | 17.55M | 0.71% |
| 05-08-2026 | 175.50 | 174.95 | 175.80 | 171.52 | 20.25M | 1.12% |
| 04-08-2026 | 173.55 | 168.25 | 174.15 | 168.02 | 25.35M | 5.18% |
| 03-08-2026 | 165.00 | 170.60 | 172.70 | 165.00 | 12.15M | -2.38% |
SAIL Share Price History (July 2026)
| Date | Closing Price | Open | High | Low | Volume | Change % |
| 31-07-2026 | 169.03 | 169.66 | 171.85 | 167.97 | 15.53M | -0.01% |
| 30-07-2026 | 169.05 | 170.70 | 171.36 | 167.60 | 11.78M | -1.12% |
| 29-07-2026 | 170.96 | 165.86 | 175.90 | 165.86 | 45.76M | 3.08% |
| 28-07-2026 | 165.85 | 162.62 | 167.30 | 160.02 | 22.21M | 1.99% |
| 27-07-2026 | 162.62 | 162.90 | 166.50 | 162.10 | 13.67M | 0.72% |
| 24-07-2026 | 161.45 | 160.25 | 162.80 | 158.01 | 8.94M | 0.34% |
| 23-07-2026 | 160.91 | 162.10 | 162.49 | 159.26 | 10.38M | -0.66% |
| 22-07-2026 | 161.98 | 164.35 | 166.19 | 160.92 | 11.62M | -1.27% |
| 21-07-2026 | 164.07 | 163.00 | 164.96 | 162.65 | 9.27M | 0.88% |
| 20-07-2026 | 162.64 | 162.90 | 165.33 | 162.14 | 8.87M | -0.25% |
| 17-07-2026 | 163.04 | 163.70 | 164.35 | 160.50 | 14.46M | -0.36% |
| 16-07-2026 | 163.63 | 165.25 | 166.40 | 162.98 | 9.42M | -0.61% |
| 15-07-2026 | 164.64 | 167.01 | 168.29 | 163.80 | 9.95M | -1.09% |
| 14-07-2026 | 166.45 | 166.08 | 168.75 | 165.55 | 11.65M | -0.34% |
| 13-07-2026 | 167.01 | 166.20 | 167.64 | 163.71 | 10.30M | -0.56% |
| 10-07-2026 | 167.95 | 168.08 | 172.27 | 167.15 | 12.02M | 1.24% |
| 09-07-2026 | 165.90 | 162.50 | 167.50 | 161.72 | 11.73M | 2.39% |
| 08-07-2026 | 162.02 | 163.95 | 165.87 | 161.33 | 10.92M | -2.20% |
| 07-07-2026 | 165.66 | 168.48 | 168.49 | 164.50 | 8.48M | -2.11% |
| 06-07-2026 | 169.23 | 169.64 | 170.92 | 167.81 | 12.79M | -0.38% |
| 03-07-2026 | 169.88 | 171.00 | 172.86 | 168.15 | 17.11M | 1.05% |
| 02-07-2026 | 168.12 | 168.00 | 169.99 | 166.00 | 23.05M | -0.09% |
| 01-07-2026 | 168.27 | 173.36 | 173.36 | 166.31 | 18.69M | -3.01% |