
Table of Contents
Gold Rate Today | MCX Gold Price Today
| City | 24 Carat Gold Rate Today (10 Gms) | 22 Carat Gold Rate Today (10 Gms) | 18 Carat Gold Rate Today (10 Gms) |
| Gold Rate Today Ahmedabad | ₹1,49,340 | ₹1,36,900 | ₹1,12,020 |
| Today Gold Rate Anantapur | ₹1,49,290 | ₹1,36,850 | ₹1,11,970 |
| Today Gold Rate Aurangabad | ₹1,49,290 | ₹1,36,850 | ₹1,11,970 |
| Gold Rate Today Bangalore | ₹1,49,290 | ₹1,36,850 | ₹1,11,970 |
| Today Gold Rate Bhubaneswar | ₹1,49,290 | ₹1,36,850 | ₹1,11,970 |
| Gold Rate Today Chennai | ₹1,49,290 | ₹1,36,850 | ₹1,12,400 |
| Today Gold Rate Coimbatore | ₹1,49,290 | ₹1,36,850 | ₹1,12,400 |
| Today Gold Rate Cuttack | ₹1,49,290 | ₹1,36,850 | ₹1,11,970 |
| Gold Rate Today Delhi | ₹1,49,440 | ₹1,37,000 | ₹1,12,120 |
| Today Gold Rate Erode | ₹1,49,290 | ₹1,36,850 | ₹1,12,400 |
| Gold Rate Today Hyderabad | ₹1,49,290 | ₹1,36,850 | ₹1,11,970 |
| Today Gold Rate Indore | ₹1,49,340 | ₹1,36,900 | ₹1,12,020 |
| Gold Price Today Jaipur | ₹1,49,440 | ₹1,37,000 | ₹1,12,120 |
| Today Gold Rate Karur | ₹1,49,290 | ₹1,36,850 | ₹1,12,400 |
| Gold Price Today Kolkata | ₹1,49,290 | ₹1,36,850 | ₹1,11,970 |
| Today Gold Rate Lucknow | ₹1,49,440 | ₹1,37,000 | ₹1,12,120 |
| Gold Price Today Ludhiana | ₹1,49,440 | ₹1,37,000 | ₹1,12,120 |
| Today Gold Rate Madurai | ₹1,49,290 | ₹1,36,850 | ₹1,12,400 |
| Gold Rate Today Mumbai | ₹1,49,290 | ₹1,36,850 | ₹1,11,970 |
| Today Gold Rate Mysore | ₹1,49,290 | ₹1,36,850 | ₹1,11,970 |
| Today Gold Rate Nagpur | ₹1,49,290 | ₹1,36,850 | ₹1,11,970 |
| Today Gold Rate Nashik | ₹1,49,330 | ₹1,36,880 | ₹1,12,000 |
| Today Gold Rate Nellore | ₹1,49,290 | ₹1,36,850 | ₹1,11,970 |
| Today Gold Rate Patna | ₹1,49,340 | ₹1,36,900 | ₹1,12,020 |
| Gold Rate Today Pune | ₹1,49,290 | ₹1,36,850 | ₹1,11,970 |
| Today Gold Rate Raipur 24 Carat | ₹1,49,290 | ₹1,36,850 | ₹1,11,970 |
| Today Gold Rate Rajkot | ₹1,49,340 | ₹1,36,900 | ₹1,12,020 |
| Today Gold Rate Salem | ₹1,49,290 | ₹1,36,850 | ₹1,12,400 |
| Today Gold Rate Solapur | ₹1,49,290 | ₹1,36,850 | ₹1,11,970 |
| Today Gold Rate Theni | ₹1,49,290 | ₹1,36,850 | ₹1,12,400 |
| Ttoday Gold Rate Tirupati | ₹1,49,290 | ₹1,36,850 | ₹1,11,970 |
| Today Gold Rate Trichy | ₹1,49,290 | ₹1,36,850 | ₹1,12,400 |
| Today Gold Rate Vijayawada | ₹1,49,290 | ₹1,36,850 | ₹1,11,970 |
| Today Gold Rate Warangal | ₹1,49,290 | ₹1,36,850 | ₹1,11,970 |
Gold Rate Today (Gold Price Today)
Block Deals NSE Today | Bulk Deal NSE
Adani Green Energy Share Price Target 2026, 2027, 2030
For traders and investors, tracking the MCX Gold Price Today provides an important view of domestic futures-market sentiment, while global gold prices, US interest rates, bond yields, the dollar and geopolitical developments help explain the broader gold price movement.
Recent market action has again highlighted how sensitive gold can be to changes in monetary-policy expectations. (reuters.com)
This guide examines the key drivers behind gold prices, what influences a gold price prediction, and the factors that could shape the gold price outlook toward 2030—helping readers understand both short-term movements and longer-term trends.
MCX Gold Price Today | MCX Gold Rate Today
| Date | MCX Gold Price |
| 12Oct 2026 | 149,550 |
| 09 Oct 2026 | 151,503 |
| 08 Oct 2026 | 149,610 |
| 07 Oct 2026 | 149,110 |
| 06 Oct 2026 | 150,120 |
| 05 Oct 2026 | 149,321 |
| 01 Oct 2026 | 150,250 |
| 30 Sept 2026 | 148,823 |
| 29 Sept 2026 | 146,804 |
| 26 Sept 2026 | 150,881 |
Gold MCX Chart
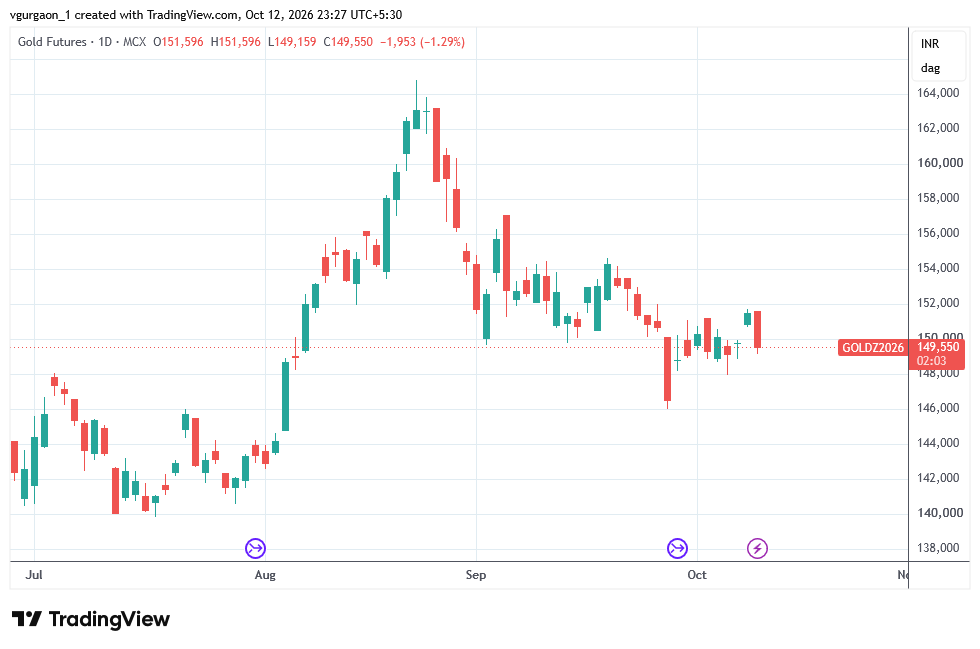
As of today, Oct 13, 2026, MCX Gold Futures (October 2026 delivery contract) are trading around ₹149,543 per 10 grams.
Gold Rate Prediction – 12 October 2026
Gold prices in India may remain volatile with a cautious recovery outlook in the near term. The market is balancing a weaker US dollar, geopolitical uncertainty and expectations about US interest rates against pressure from rising yields.
According to recent market reports, MCX gold has been trading around the ₹1.46–₹1.52 lakh per 10 grams region, depending on the contract and session. On October 9, international gold rose more than 1% as oil prices eased and the US dollar weakened.
Forecast date: Saturday, 10 October 2026. Indian gold markets may be closed for the weekend, so the next-session outlook refers to Monday, 12 October 2026. Forecasts are estimates, not guaranteed prices.
Gold Rate outlook
Key levels for Tuesday, 13 October
Gold’s near-term outlook in India depends on three major factors: international gold prices, the US dollar and interest-rate expectations, and the rupee’s movement against the dollar. Domestic prices can also differ across cities because of taxes, premiums and jeweller charges.
For the next seven days, 13–19 October 2026, the most useful approach is to track support and resistance levels and prepare for both bullish and bearish scenarios rather than assume gold will move in one direction.
1. Latest gold prices in India
Reference prices reported on 12 October 2026; retail rates may vary by city and jeweller.
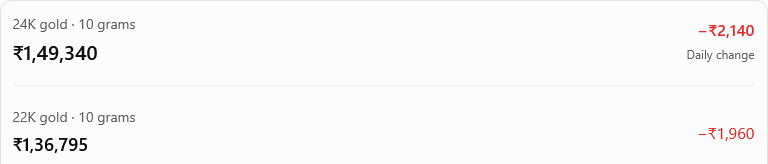
Source: Mint India gold rates. Retail prices exclude applicable making charges and may differ from final jewellery bills.
International spot gold also weakened on 12 October, falling about 0.5% to $4,172.36 per ounce as a stronger US dollar weighed on prices. Investors were awaiting US inflation data for clues about the Federal Reserve’s interest-rate outlook.
2. Gold rate forecast: 13–19 October 2026
My assessment is cautious and volatile in the near term, with a potential recovery if gold holds support and the dollar weakens.
Indicative scenario ranges for domestic MCX gold futures, per 10 grams — not guaranteed price targets.
| Scenario | Indicative price zone | What could trigger it? |
|---|---|---|
| Bullish recovery | ₹1,50,000–₹1,53,000 | Weaker dollar, lower bond yields, safe-haven demand |
| Sideways trading | ₹1,46,000–₹1,50,000 | Mixed global signals and consolidation |
| Bearish correction | ₹1,43,000–₹1,46,000 | Strong dollar, higher yields, sustained selling |
These are conditional planning ranges, not a statistically validated forecast. They use recent domestic trading levels as reference points; the current futures contract and live prices should be checked before placing a trade. Recent market commentary identifies around ₹1.46 lakh as support and ₹1.53–₹1.55 lakh as an initial resistance zone.
3. Key support and resistance levels
Resistance: ₹1,50,000–₹1,53,000
A sustained move above this zone would improve the short-term recovery outlook.
Pivot zone: ₹1,48,000–₹1,50,000
Watch whether prices stabilize or face renewed selling pressure.
Support: ₹1,46,000
A decisive break below this level could expose gold to further downside.
These levels refer to domestic futures, not the retail price of 24K jewellery gold.
4. What could move gold this week?
- US inflation data: Higher-than-expected inflation could strengthen expectations of elevated interest rates, potentially pressuring gold.
- US dollar and bond yields: A weaker dollar and falling yields would generally support bullion.
- Geopolitical tensions: Heightened uncertainty can increase safe-haven demand.
- Indian rupee: A weaker rupee can raise domestic gold prices even when international gold is flat; rupee appreciation can have the opposite effect.
Reuters reported that the US dollar was near an 18-month high on 12 October, while geopolitical tensions were lifting oil prices and keeping investors cautious.
5. Expert strategy recommendation
For jewellery buyers
Consider buying in planned instalments instead of committing the entire budget on one day. Compare local 22K and 24K rates and account for making charges.
For short-term traders
Avoid chasing sharp moves. Look for confirmation around the support and resistance zones, and define a stop-loss before entering a position.
For long-term investors
Evaluate gold as a portfolio diversifier rather than relying on a seven-day forecast. Avoid making allocation decisions solely on short-term price movements.
Bottom line: Gold’s short-term direction remains uncertain. A recovery is possible if support holds and global conditions become more favourable, but a stronger dollar and rising yields could prolong the correction. The next major signal is whether gold can reclaim resistance rather than simply rebound for one session.
Suggested Reading
Mounting rate hike bets keep weekly loss in sight for gold
Retail gold prices can vary across India even when the underlying gold market price is the same. The final price paid by a customer depends on several factors:
- City: Gold rates may differ slightly between cities because of local market conditions, transportation costs, and dealer premiums.
- Jeweller: Different jewellers may quote different rates based on their sourcing costs, margins, and pricing policies.
- GST: GST adds to the applicable purchase price and affects the final amount paid by the customer.
- Making Charges: Jewellery includes labour and craftsmanship costs, which can vary significantly by design and jeweller.
- Local Taxes: Local market charges, levies, or other applicable costs can influence the final retail price.
- Purity: 24K gold has a higher gold content than 22K, 18K, or other grades, so prices differ according to purity.
- Jewellery Type: Rings, necklaces, bangles, chains and other products can have different making charges and wastage components.
Important: The quoted Gold Price Today is therefore not always the same as the final price you pay for gold jewellery. For an accurate comparison, check the gold rate, purity, GST, making charges and any other applicable charges before purchasing.
FAQs
Gold rate today 22k
The 22-karat (22K) gold rate today in India is approximately ₹13,640 to ₹13,865 per gram (around ₹1,36,400 to ₹1,38,650 per 10 grams) depending on the city and jeweller, such as Tanishq Gold Rate. [1, 2, 3]
24 carat gold rate today in Bengaluru
The 24-carat gold rate in Bangalore today is ₹14,880 per gram (₹148,800 per 10 grams) according to the Times of India. [1]
1 gram gold rate today in Gurgaon
The 1-gram gold price in Gurugram (Gurgaon) is approximately ₹14,453 to ₹14,895 for 24-karat gold and ₹13,528 to ₹13,765 for 22-karat gold, according to updates from the Angel One Gold Rate Portal and BankBazaar Gurgaon.
Todays gold rate Maharashtra
The Gold Rate in Maharashtra for 24-karat gold is approximately ₹14,401 to ₹15,016 per gram, and 22-karat gold is around ₹13,715 to ₹13,764 per gram. [1, 2, 3]
Gold rate today 22 carat in Gujarat
The 22-carat gold rate in Gujarat today is approximately ₹13,869 per gram, as reported by the Economic Times. [1]
Gold rate today 18 carat up Uttar Pradesh
The Times of India lists the 18-carat gold rate in Uttar Pradesh at approximately ₹11,175 per gram (or around ₹1,11,750 per 10 grams), though prices can slightly vary by city such as Lucknow, Kanpur, or Ghaziabad. [1, 2]
How are global spot gold prices affecting Indian bullion?
Global spot gold prices directly transmit volatility to Indian bullion markets, primarily via Multi Commodity Exchange (MCX) futures and local retail spot pricing. The ongoing transmission mechanism plays out through a few distinct channels:
1. Direct Price Tracking & Intraday Pressure
Because India is a major price-taker in the international bullion space, domestic contracts mirror global spot dynamics. High U.S. Dollar Index (DXY) benchmarks and multi-decade high U.S. Treasury yields have dragged global spot gold down from its prior highs to around $4,130 – $4,170 per ounce. This global downward momentum has dragged domestic benchmark MCX gold futures under the psychological threshold, pushing them down to near ₹1,49,000 per 10 grams.
2. The Currency Conversion Overlay (USDINR)
Domestic bullion prices are calculated by converting global dollar-denominated spot prices into Indian rupees, adding local import duties and taxes. When international spot gold undergoes sharp sell-offs, the downside impact on Indian bullion is often dampened if the Indian Rupee depreciates against the U.S. dollar. This domestic currency insulation means MCX prices can remain relatively firm even when international boards register steeper percentage losses.
3. Shift in Macro Sentiment
Global spot gold’s reaction to major international data—such as U.S. Core PCE, unemployment, and crude oil shocks—sets the trend for Indian institutional positioning. For example, whenever fading global expectations of aggressive Federal Reserve interest rate hikes cap international liquidations, domestic floor support strengthens across Indian accumulation zones.
How is the USDINR exchange rate affecting import costs?
The USDINR exchange rate is currently trading at all-time highs near ₹96.40, which significantly elevates the cost of landing imported commodities in India. Because global commodities like crude oil, gold, and electronic components are priced internationally in U.S. Dollars (USD), a weaker Indian Rupee (INR) inflates the conversion cost.
Specifically for bullion, this means that even when international spot gold prices decline, the high USDINR conversion multiplier acts as a shock absorber that limits the price drop locally, keeping domestic Multi Commodity Exchange (MCX) futures relatively expensive.
What factors impact the price of gold?
Gold prices are influenced by macroeconomics and global sentiment:
The U.S. Dollar (USD): Gold is dollar-denominated, meaning it typically shares an inverse relationship with the USD. A weaker dollar makes gold cheaper for foreign buyers, driving prices up.
Interest Rates: Since gold pays no yield or dividend, higher interest rates usually make income-producing assets (like bonds) more attractive, putting downward pressure on gold.
Geopolitics & Central Banks: Wars or economic instabilities increase safe-haven demand, while large-scale gold buying by central banks boosts international prices.
What are the main drawbacks of investing in gold?
No Yield: Gold does not produce cash flow, interest, or dividends.
Storage Costs: Physical gold requires insurance and secure vaults, which adds to immediate expenses.
Opportunity Cost: Money tied up in gold might miss out on compounding gains from higher-growth equities.
How do gold ETFs differ from physical gold?
Gold ETFs (Exchange-Traded Funds) and physical gold differ primarily in ownership structure, costs, liquidity, and storage convenience:
1. Ownership & Convenience
Physical Gold: You take direct ownership of tangible metal in the form of coins, bars, or jewelry. This requires secure storage (such as a home safe or bank locker) and insurance.
Gold ETFs: You own shares in a fund that holds physical gold bullion as its underlying asset. It trades on a stock exchange like an individual stock, meaning you do not handle the metal yourself.
2. Transaction Costs & Premiums
Physical Gold: Purchases generally incur high maker charges, dealer premiums over the live spot price, and potentially lower resale values due to melt or refining fees.
Gold ETFs: Bought and sold at live market prices with minimal spreads. However, they carry an annual expense ratio (management fee) that subtly reduces the fund’s net asset value (NAV) over time.
3. Liquidity
Physical Gold: Liquidating physical gold requires visiting a dealer or jeweler, where your assets must be evaluated for purity, which can delay the transaction.
Gold ETFs: Highly liquid and can be bought or sold instantly during standard stock market trading hours.
4. Purity & Security
Physical Gold: Purity varies and requires validation or certification (such as assay cards or hallmarking). There is also a risk of theft.
Gold ETFs: The underlying gold is securely vaulted by a custodian bank and routinely audited to ensure 99.5% investment-grade purity, eliminating individual storage and theft risks.
What percentage of my portfolio should be in gold?
Most financial advisors generally recommend allocating between 5% to 10% of your total portfolio to gold.
The specific allocation that is right for you depends on your investment strategy, risk tolerance, and current market conditions:
Conservative Strategy (5% or less): If you are focused primarily on high-growth equities and bonds, a minimal allocation acts purely as an emergency insurance policy against unexpected financial crises or extreme hyperinflation.
Balanced Strategy (5% to 10%): A standard allocation for a diversified portfolio. This amount is typically large enough to cushion the impact of a stock market crash, but small enough that it won’t severely drag down your long-term compounding growth during bull markets.
All-Weather or Defensive Strategy (10% to 15%): Investors who are highly risk-averse, anticipating an extended economic recession, or nearing retirement sometimes opt for a higher allocation to maximize stability and preserve wealth.
Because gold is a non-yielding asset (it does not pay dividends or interest), allocating much more than 15% is generally discouraged, as it introduces a high opportunity cost compared to income-generating investments.
How has gold performed historically during market crashes?
Historically, gold has demonstrated a clear pattern of outperforming major stock indexes during severe equity bear markets and systemic market crashes. According to historical tracking, gold has posted positive overall returns in 7 out of 9 major stock market crashes over the past half-century.
However, its behavior during a crash typically unfolds in two distinct phases:
Phase 1: The Initial Liquidity Crunch (Brief Drop)
When a massive stock market crash first hits, gold often drops briefly along with stocks. This happens because institutional investors and hedge funds face massive margin calls across their equity portfolios. To raise immediate cash, they are forced to liquidate their most liquid and profitable assets—which frequently includes gold.
Example: In the 2008 Great Recession, gold initially dropped by about 28% during the peak panic of the credit crunch before finding its footing.
Phase 2: The Flight to Safety (Massive Rally)
Once the initial forced liquidation phase slows down, gold historically enters a powerful safe-haven rally. As central banks respond to the crash by cutting interest rates and printing currency (quantitative easing), the purchasing power of paper fiat money erodes. Investors turn to gold because it carries no counterparty risk, leading to significant price appreciation while stocks remain mired in a slump.
Historical Performance During Key Crises:
2008 Great Recession: While the S&P 500 lost roughly 57% peak-to-trough, gold recovered aggressively from its initial drop and rallied over 100% by 2011.
2020 COVID-19 Crash: The S&P 500 fell 34% in just over a month. Gold dipped momentarily during the initial March panic but quickly decoupled and surged to new all-time highs by August 2020 as global rates plummeted.
2000 Dot-Com Bubble: The S&P 500 crashed by 49%. Gold initially fell slightly due to weak sector sentiment in the late ’90s but fundamentally decoupled from the tech sector, paving the way for a massive multi-year bull run.