

Table of Contents
Tata Steel Share Price Target 2026, 2027, 2030
Analysis date: 18 October 2026 | NSE: TATASTEEL | BSE: 500470
Tata Steel’s future share price will depend on its ability to sustain Indian steel margins, expand production, improve overseas profitability and manage its debt while funding new projects.
MCX Gold Price Today | Gold Rate Today
HAL Share Price Target 2026, 2027, 2030
Tata Motors Share Price Target 2026, 2027, 2030
The company’s FY2026 performance improved significantly. Consolidated revenue reached ₹2,32,140 crore, EBITDA rose to ₹34,848 crore, and profit after tax increased to ₹10,886 crore. However, steel is a cyclical business, so these earnings cannot automatically be extrapolated into future years.
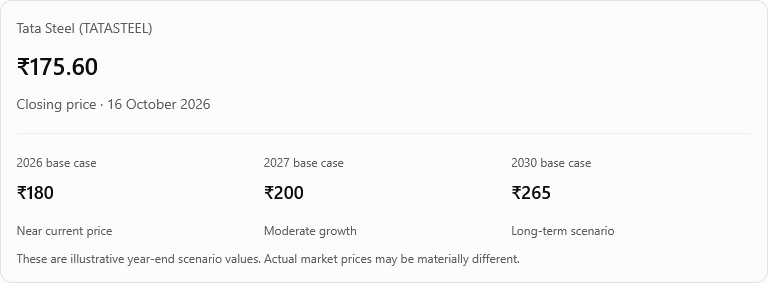
For this Tata Steel share price forecast, the latest verified closing price available for the analysis date is approximately ₹175.60 on 16 October 2026.
The targets below are my illustrative valuation scenarios, not official company guidance or guaranteed predictions.
Tata Steel business and growth outlook
1. Macro Tailwinds: The India Growth Engine
The assumption that Indian steel demand will support long-term consumption is heavily backed by real-time economic indicators.
- Fastest Growing Market: The World Steel Association projected that India’s steel demand will expand by 7.9% in 2026 and 8.0% in 2027, solidifying it as the fastest-growing major steel market globally.
- Policy Support: The Indian government recently unveiled its draft National Steel Policy Vision 2047, which targets expanding the country’s crude steel capacity to 604 million tonnes by 2047. This gives multi-decade policy tailwinds to domestic infrastructure, manufacturing, and automotive pipelines.
2. Aggressive Capital Re-Allocation (Capex)
Tata Steel is actively shifting its focus away from capital-draining European operations to aggressively fund high-margin Indian capacity.
- Increased Capex Budgets: For the fiscal year 2026–27 (FY27), Tata Steel stepped up its capital expenditure plan by 38% to approximately ₹20,000 crore (up from ₹14,559 crore in FY26).
- India-First Strategy: Out of this ₹20,000 crore outlay, 60% (roughly ₹12,000 crore) is specifically earmarked for Indian expansions, technology adoption, and downstream capabilities to ride the domestic demand wave.
3. Key Projects: Megawatt Scale Expansion at NINL
The mentioned ₹33,873 crore project at Neelachal Ispat Nigam Limited (NINL) is a flagship component of the company’s mid-term goal to expand its domestic crude steel capacity past 40 MTPA.
- Phase-1 Execution: The project has completed its core engineering phases and is moving into active deployment. Adding 4.8 MTPA will scale up the plant’s overall capacity to 6.2 MTPA.
- Strategic Product Mix: Upstream infrastructure (blast furnaces, melt shops) will feed directly into downstream long-product capacities like rebar, wire rod, and structural section mills. This strengthens Tata Steel’s presence in the highly lucrative retail and construction steel segments.
- Recent Kalinganagar Milestones: Complementing NINL, Tata Steel newly commissioned a cumulative ₹9,067 crore suite of advanced downstream facilities at its Kalinganagar plant, including two Continuous Galvanising Lines (1 MTPA combined capacity) and a Continuous Annealing Line to supply high-end coated advanced automotive steels.
4. Moving Up the Value Chain & Cost Restructuring
- Branded & Retail Segments: To mitigate cyclical downturns in global commodity steel prices, Tata Steel is scaling up its value-added verticals. Brands like Tata Tiscon and Tata Steelium have delivered record delivery volumes, and their e-commerce platforms (Tata Steel Aashiyana) have registered strong annualized growth.
- Mitigating the European Drag: European segments (UK and Netherlands) have long compressed consolidated margins due to sluggish auto markets and regulatory transitions. Restructuring efforts, asset transitions to low-emission pathways, and cost reduction measures aim to push the UK operations back into positive EBITDA territory by FY29.
The Bottom Line: Margin vs. Volume
The text correctly outlines the fundamental economic truth: “Capacity growth creates value only if the additional steel can be sold at attractive margins.”
Tata Steel’s current execution addresses this risk directly. Rather than just creating raw volume, the capital focus is on adding downstream value (galvanizing lines, specialty auto steel, and retail wires). By concentrating its expansion within India—where domestic prices and market consumption outpace stagnant Western fields—the company ensures that its newly added capacities serve high-demand segments that can absorb the extra volume at profitable margins.
Tata Steel financial performance: Latest results
Financial Direction and Operating Leverage
Tata Steel experienced significant positive operating leverage in FY2026. While revenue registered a stable growth of approximately 6.22%, EBITDA surged by 35.06%. This disproportionate growth indicates that fixed expenses were efficiently managed, and variable costs did not rise symmetrically with sales volumes.
The expansion of the EBITDA margin by 320 basis points (moving from 11.8% to 15.0%) serves as quantitative proof that the company successfully improved its internal cost structures, optimized its logistics footprint, and sold a higher proportion of value-added products (like branded construction and automotive steels).
Net Profit and De-leveraging Dynamics
The most notable bottom-line highlight is Profit After Tax (PAT), which multiplied over three-fold, rising from ₹3,174 crore to ₹10,886 crore. This sharp surge was primarily driven by:
- Higher core operating cash flows (EBITDA).
- Steady de-leveraging, as net debt at year-end was brought down by ₹2,286 crore to finish at ₹80,144 crore.
Lowering the absolute net debt burden alongside expanding operating profitability collectively dropped the Net Debt/EBITDA leverage ratio from a highly geared 3.2x down to a much safer 2.3x. A ratio closer to 2.0x vastly improves Tata Steel’s fiscal flexibility, enabling it to better finance upcoming capital projects (such as the ₹33,873 crore expansion at NINL) without relying heavily on expensive external borrowings.
Assessing Operational Metrics (Q2 FY2027)
While the full-year audited figures validate historical strengthening, the operational update published on October 7, 2026, acts as a near-term health check. Operational production and delivery metrics often serve as leading volume indicators that map directly into future revenues; however, because they lack final material costs, raw material inventory price adjustments (e.g., volatile coking coal inputs), and corporate tax provisions, they cannot be equated to complete quarterly earnings.
Summary & Insights
Calculated using Google Finance data. Might be shortened for brevity.
| Financial Metric | FY2025 | FY2026 | Direction |
|---|---|---|---|
| Revenue | ₹2,18,543 | ₹2,32,140 | Improved |
| EBITDA | ₹25,802 | ₹34,848 | Improved |
| EBITDA Margin | 11.80% | 15.00% | Expanded |
| Profit After Tax (PAT) | ₹3,174 | ₹10,886 | Improved sharply |
| Net Debt at Year-End | ₹82,430 | ₹80,144 | Reduced |
| Net Debt / EBITDA | 3.2x | 2.3x | Improved |
Analysis of Quarterly Performance Trends
Evaluating Tata Steel’s (NSE:TATASTEEL, BOM:500470) consecutive quarterly numbers provides visibility into its operational seasonality, pricing power, and near-term trajectory.
1. Sustained Year-on-Year (YoY) Recovery
Comparing Q1 FY2027 against Q1 FY2026 points to fundamentally stronger business health:
- Revenue expansion: Sales expanded by 14.32%, climbing from ₹53,178 crore to ₹60,794 crore.
- Operating leverage: EBITDA scaled up faster than top-line revenue, posting a 25.27% increase (to ₹9,370 crore up from ₹7,480 crore). This disproportionate growth indicates better structural efficiencies and a higher-margin product configuration.
- EBITDA Margin: Profitability per rupee of sales expanded by 130 basis points from 14.1% to 15.4%.
- Bottom-line growth: Profit After Tax (PAT) grew by 18.83%, securing an additional ₹378 crore over the previous year’s opening quarter.
2. Sequential Quarter-on-Quarter (QoQ) Deceleration
Evaluating Q1 FY2027 against the preceding Q4 FY2026 highlights why linear projections in global commodities fail:
- Revenue contraction: Turnover softened by 3.91% sequentially.
- Operating compression: EBITDA slid by 5.86% while PAT retracted by 19.56% relative to the final quarter of FY2026.
- Seasonality and Cyclicality: The primary structural reason for this compression is cyclical pricing corrections. Q4 (January–March) historically exhibits peak structural delivery volumes in India due to fiscal wrap-ups in corporate projects. Conversely, Q1 (April–June) coincides with global macro pauses and input price volatility (such as shifting coking coal prices), compressing real margin realization.
3. Operational Leading Indicators (Q2 FY2027)
The provisional figures released for Q2 FY2027 point toward sustained domestic consumption momentum inside India:
- Crude Steel Production: Scaled to 6.21 million tonnes, establishing a double-digit volume growth of 10% YoY.
- Steel Deliveries: Climbed to 5.97 million tonnes, achieving a 7% YoY increase.
These operational data points confirm robust capacity utilization and solid product offtake across infrastructure and retail channels. However, as of today, October 18, 2026, final Q2 financial results remain unreleased. While strong operational volumes generally suggest an expanding top-line, the final financial print will remain highly contingent on whether average steel selling prices (NSR) held up against shifting regional inputs.
Summary & Insights
Calculated using Google Finance data. Might be shortened for brevity.
| Consolidated Metric | Q1 FY2026 | Q4 FY2026 | Q1 FY2027 |
|---|---|---|---|
| Revenue (₹ crore) | ₹53,178 | ₹63,270 | ₹60,794 |
| EBITDA (₹ crore) | ₹7,480 | ₹9,953 | ₹9,370 |
| EBITDA Margin | 14.10% | 15.70% | 15.40% |
| PAT (₹ crore) | ₹2,007 | ₹2,965 | ₹2,385 |
2026 analysis cutoff.
Cash flow, returns and balance-sheet strength
1. The Dynamic of Cash Flow vs. Capex Execution
- Operating Cash Flow (OCF): The massive ~65% year-on-year jump to ₹29,254 crore reflects higher core operational profitability (EBITDA) and working capital release (efficient management of inventories, faster collection of receivables, and optimization of trade payables).
- The Free Cash Flow (FCF) Catch: While an OCF of ₹29,254 crore is robust, it must be evaluated alongside the company’s capital allocation pipeline. Since Tata Steel stepped up its capital expenditure plan toward a ₹20,000 crore annual run-rate for expansions like the Neelachal Ispat Nigam Limited (NINL) project, true Free Cash Flow (
OCF−Capex) is much tighter than the headline OCF implies. True value creation depends on keeping this net FCF positive after sustaining these massive domestic infrastructure investments.
2. Credit Profile and De-leveraging Momentum
- Leverage Correction: Bringing net debt down to ₹80,144 crore as of March 31, 2026, significantly reduces systemic financial risks.
- The 2.3x Benchmark: In highly cyclical industries like steel, a Net Debt-to-EBITDA ratio of 2.3x is considered a healthy credit milestone. When a downturn occurs and steel prices soften, EBITDA shrinks; a lower starting leverage multiplier prevents the company from quickly stepping into a debt distress zone (above 3.5x). This room allows Tata Steel to keep borrowing costs stable while proceeding with its multi-billion rupee domestic capacity additions.
3. Capital Efficiency (ROE and ROCE)
- The Return Profile: The mid-October 2026 snapshot shows a Return on Equity (ROE) of 11.7% and a Return on Capital Employed (ROCE) of 12.5%.
- What These Ratios Tell Us: An ROCE of 12.5% means that for every ₹100 of total capital deployed (debt + equity), Tata Steel generates ₹12.50 in operating profit. An ROE of 11.7% indicates the net return specifically left over for shareholders. For a capital-intensive manufacturing business transitioning out of a heavy structural drag in Europe, these returns demonstrate that its core assets are turning increasingly productive, though they still have room to expand as higher-margin Indian facilities fully ramp up.
Tata Steel valuation analysis
Structural Elaboration on Tata Steel’s Valuation Analysis
Evaluating a heavily cyclical, asset-heavy integrated steel giant like Tata Steel (NSE:TATASTEEL, BOM:500470) solely on a snapshot trailing Price-to-Earnings (P/E) multiple can be highly misleading. The current valuation structure captures why the market treats Tata Steel with a distinct “growth premium” compared to domestic competitors.
1. Peer Group Multiple Dissection
As of mid-October 2026, the equity market shows the following valuation landscape for major domestic steel producers:
- Tata Steel: P/E of 20.0x | P/B of 2.1x
- SAIL (Steel Authority of India Ltd): P/E of 16.4x
- JSW Steel: P/E of 11.8x | P/B of 3.5x
Why Tata Steel Commands a Premium Multiple
Historically, a high P/E in a commodity stock implies either depressed trailing earnings or a strong forward outlook. In Tata Steel’s context, the premium is driven by a structural shift rather than market over-exuberance:
- The India Capital Pivot: The market is pricing in the company’s intentional transition out of low-margin, regulatory-heavy European fields (such as the UK asset transformations) toward highly profitable domestic capacities.
- Backward Integration Defensibility: Tata Steel owns fully captive iron ore mines in India, giving it structural cost protection that merchant buyers do not possess.
Conversely, JSW Steel trades at a lower trailing P/E (11.8x) but commands a significantly higher Price-to-Book multiple (3.5x). This signals that the market rewards JSW for high near-term capacity utilization and return profiles but demands more conservative pricing on Tata Steel’s unmined or restructuring asset footprint. SAIL (16.4x) captures a lower state-owned operational discount despite its extensive infrastructure.
2. The Cyclical Value Trap: The P/E Paradox
The peer comparison highlights a core tenet of cyclical investing: Commodity stocks look cheapest at peak earnings and most expensive at structural troughs.
When steel prices climb globally, earnings swell rapidly, compressing the trailing P/E down into the single digits (making it look “cheap” right before demand drops). Conversely, during periods of restructuring or raw material price volatility (such as shifting global coking coal costs), earnings decline faster than the share price adjusts, causing the P/E multiple to spike significantly. Therefore, Tata Steel’s multiple of 20.0x represents mid-cycle positioning: earnings have improved sharply over FY2025/26, but the total operating leverage from new expansions (like the 4.8 MTPA project at NINL) is not yet fully realized.
3. Enterprise Value to EBITDA (EV/EBITDA) Context
The text notes that EV/EBITDA is an indispensable metric here. Because steel making requires massive capital deployment, debt levels vary drastically across corporate balances. Standard P/E only accounts for equity value and ignores the capital structure underneath.
null
As of mid-October 2026, Tata Steel’s Trailing Twelve Month (TTM) EV/EBITDA is hovering between 8.2x and 9.1x.
- This multiple sits safely near its historical 5-year average of 8.7x–9.0x, indicating that when absolute debt burdens are factored into operating profits, the company is valued cleanly at fair mid-cycle historic rates.
- The stabilization of this multiple proves that the absolute debt contraction achieved in FY2026 (net debt trimmed to ₹80,144 crore) has effectively counterbalanced capital expenditure outlays, preventing value dilution for equity shareholders.
Summary & Insights
Calculated using Google Finance data. Might be shortened for brevity.
| Company Ticker | Share Price (Oct 2026) | Trailing P/E Multiple | Price-to-Book (P/B) |
|---|---|---|---|
| Tata Steel (NSE:TATASTEEL) | ₹175.50 | 20.0x | 2.1x |
| SAIL (INDEXNSE:NIFTY_METAL) | ₹170.95 | 16.4x | 1.2x |
| JSW Steel (NSE:JSWSTEEL) | ₹1,216.30 | 11.8x | 3.5x |
Tata Steel Share Price Target 2026
| Scenario | Estimated EPS | Assumed P/E | Implied target | Upside/downside vs. ₹175.60 |
|---|---|---|---|---|
| Bear case | ₹8.50 | 14x | ₹119 | -32% |
| Base case | ₹10.50 | 17x | ₹179 | +2% |
| Bull case | ₹12.00 | 20x | ₹240 | +37% |
Analysis & Interpretation
1. Bear Case Analysis (Downside Risk: -32%)
- The Catalyst: This scenario plays out if global steel margins face sharp corrections, coking coal input costs spike, or European operations (UK/Netherlands) see deep structural execution delays.
- The Valuation Double-Whammy: Cyclical companies suffer what is known as “multiple compression” when earnings decline. If EPS shrinks to ₹8.50, the market will likely strip away the stock’s growth premium, dropping the P/E multiple down to a conservative 14x. This values the company down at an implied target of ₹119, a sharp 32% drop from current levels.
2. Base Case Analysis (Limited Near-Term Upside: +2%)
- The Catalyst: The base case implies that the current market price of ~₹175.60 already efficiently prices in the company’s immediate operational highlights. This relies on stable domestic infrastructure demand and steady executions of the 4.8 MTPA expansion project at NINL.
- The Mid-Cycle Anchor: An EPS of ₹10.50 coupled with a historical average mid-cycle multiple of 17x puts the target valuation at ₹179. This minor 2% variance confirms that unless a major macro shift happens, the stock is currently trading at fair intrinsic value.
3. Bull Case Analysis (Upside Potential: +37%)
- The Catalyst: This optimistic path requires maximum capacity performance across Indian plants, a sharp recovery in global auto-steel demand, and a swift shift of the European business into positive EBITDA territory.
- The Premium Multiplier: If EPS scales to ₹12.00, the market will confidently reward Tata Steel with a growth-oriented, high-end multiple of 20x. This structure unlocks an implied target of ₹240, showcasing strong 37% potential returns for equity holders.
Tata Steel Share Price Target 2027
| Scenario | Estimated EPS | Assumed P/E | Implied target | Upside/downside vs. ₹175.60 |
|---|---|---|---|---|
| Bear case | ₹9.50 | 13x | ₹124 | -29% |
| Base case | ₹12.50 | 16x | ₹200 | +14% |
| Bull case | ₹15.00 | 20x | ₹300 | +71% |
1. Bear Case Scenario (Downside Risk: -29%)
- The Drivers: This defensive outcome assumes that global steel spreads undergo structural compression, caused by weak demand or global overcapacity. Locally, it maps out a scenario where domestic input price hikes (like higher coking coal outlays) compress operating margins, while ongoing asset overhauls in the UK remain a capital drag.
- The Valuation Multiplier: If forward EPS drops to ₹9.50, the market is highly likely to adjust its structural valuation downward. In highly cyclical metal sectors, down-cycles strip away growth premiums, lowering the trailing P/E multiple to 13x. This contraction establishes an implied target of ₹124, translating to a 29% correction from the ₹175.60 baseline.
2. Base Case Scenario (Moderate Growth Anchor: +14%)
- The Drivers: The realistic base case is anchored on the successful commercialization of capital projects, particularly the 4.8 MTPA crude steel expansion at Neelachal Ispat Nigam Limited (NINL). It presumes that India’s domestic consumption across construction, infrastructure, and automotive remains robust enough to absorb new volumes.
- The Value Alignment: Assuming a normalized forward EPS of ₹12.50 paired with a steady mid-cycle P/E multiple of 16x, the baseline fields a target price of ₹200. Achieving this indicates that Tata Steel will successfully scale up its high-margin domestic product configuration, matching its growing underlying book value without relying on global commodity pricing booms.
3. Bull Case Scenario (High Operating Leverage: +71%)
- The Drivers: This highly optimistic case requires a perfect alignment of operational factors. It demands that the company’s domestic value-added brands (Tata Tiscon, Tata Steelium) capture record premium pricing, the European business transitions into positive EBITDA territory, and debt levels are aggressively reduced through operating cash flows.
- The Growth Premium: Capitalizing on top-tier operating leverage, forward EPS would expand to ₹15.00. The equity markets would then reward Tata Steel with a premium growth multiple of 20x, similar to historical peaks during domestic infrastructure expansion phases. This scenario unlocks a target price of ₹300, representing an upside potential of 71%.
Tata Steel Share Price Target 2030
| Scenario | Estimated FY2030 EPS | Assumed P/E | Implied target | Upside/downside vs. ₹175.60 |
|---|---|---|---|---|
| Bear case | ₹12 | 11x | ₹132 | -25% |
| Base case | ₹17.50 | 15x | ₹263 | +50% |
| Bull case | ₹24 | 19x | ₹456 | +160% |
1. Bear Case Scenario (Downside Risk: -25%)
- The Execution Trap: This path assumes that Tata Steel builds out its targeted 40 MTPA capacity, but does so by taking on high debt, right as global steel markets enter a prolonged cyclical downturn.
- Asset Over-Allocation: If domestic infrastructure demand slows down, the market will face oversupply. This will force plants to run at lower utilization rates, driving up fixed costs per ton.
- Financial Impact: In this scenario, intensive capital expenditure outlays fail to generate strong returns on capital employed (ROCE). Long-term EPS gets squeezed down to ₹12. As a result, the market de-rates the stock down to a lower tier multiple of 11x, leaving the implied share target at ₹132.
2. Base Case Scenario (Stable Domestic Scaling: +50%)
- The Structural Core: The base case assumes India’s domestic consumption stays resilient, growing steadily alongside the country’s broader GDP expansion.
- Profitable Growth: In this scenario, the company successfully scales its capacity up toward 35 MTPA. Crucially, it manages to maintain an optimized product mix, where over 50% of shipments come from high-margin branded construction products (Tata Tiscon) and specialized automotive steel.
- Financial Impact: Operating efficiencies and complete captive iron ore self-sufficiency protect margins during brief global pricing corrections. This stable environment pushes long-term sustainable EPS up to ₹17.50. Valued at a normalized, mid-cycle long-term multiple of 15x, the stock reaches an anchored target price of ₹263.
3. Bull Case Scenario (The Structural Super-Cycle: +160%)
- The Best-Case Realization: This highly optimistic path requires a perfect economic environment. It depends on a structural manufacturing boom in India, absolute de-leveraging of the balance sheet, and a successful shift of European assets into high-margin green steel operations.
- Peak Efficiency: Operating at an aggressive 40 MTPA run-rate with fully optimized downstream integration, the company maximizes its internal operating leverage.
- Financial Impact: Free cash flows rise substantially, sending long-term EPS soaring to ₹24. Institutional investors reward this clean, asset-heavy growth engine with a premium valuation multiple of 19x, unlocking an implied share target of ₹456.
Tata Steel Share Price Target 2026, 2027, 2030: Bull vs Base vs Bear
The following consolidated table provides rounded, illustrative year-end targets.
| Year | Bear case | Base case | Bull case | Key assumption |
|---|---|---|---|---|
| 2026 | ₹119 | ₹179 | ₹240 | FY2027 earnings and near-term steel margins |
| 2027 | ₹124 | ₹200 | ₹300 | Earnings growth and successful operating execution |
| 2030 | ₹132 | ₹263 | ₹456 | Capacity growth, normalised margins and valuation |
All values are calculated scenario outputs, not predictions guaranteed to occur. They exclude dividends and transaction costs.
Earnings and EPS projections
The following projections are analytical assumptions constructed for valuation purposes. They are not official Tata Steel guidance or independently verified analyst-consensus estimates.
| Financial year | Bear EPS | Base EPS | Bull EPS |
|---|---|---|---|
| FY2027 | ₹8.50 | ₹10.50 | ₹12.00 |
| FY2028 | ₹9.50 | ₹12.50 | ₹15.00 |
| FY2029 | ₹10.50 | ₹15.00 | ₹19.00 |
| FY2030 | ₹12.00 | ₹17.50 | ₹24.00 |
Why these EPS assumptions?
- Bear case: Steel prices or operating margins weaken, overseas losses remain material, and additional capacity takes longer to deliver acceptable returns.
- Base case: Indian volumes grow, margins remain reasonably healthy across the cycle, cost savings continue and debt gradually becomes more manageable.
- Bull case: Strong domestic demand, favourable steel spreads, higher-value products, successful capacity expansion and improved overseas operations combine to produce stronger earnings.
The FY2030 base-case EPS of ₹17.50 is approximately twice the illustrative FY2027 base-case EPS of ₹10.50. That is a meaningful earnings-growth assumption, not a simple continuation of historical growth.
How We Calculated the Tata Steel Share Price Target
The basic calculation is:
\[ \text{Target Price}=\text{Estimated EPS}\times\text{Assumed P/E} \]
Base-case calculations
| Target year | EPS assumption | P/E assumption | Calculation | Rounded target |
|---|---|---|---|---|
| 2026 | ₹10.50 | 17x | ₹10.50 × 17 | ₹179 |
| 2027 | ₹12.50 | 16x | ₹12.50 × 16 | ₹200 |
| 2030 | ₹17.50 | 15x | ₹17.50 × 15 | ₹263 |
The unrounded calculations are ₹178.50, ₹200 and ₹262.50, respectively.
Why use these valuation multiples?
- 2026 — 17x: This is below the approximately 18.5x trailing P/E indicated by the mid-October market-data snapshot. The modest discount recognises steel cyclicality and execution risks.
- 2027 — 16x: A slightly lower multiple allows for normalisation of the valuation as earnings grow, rather than assuming a continuing premium.
- 2030 — 15x: The long-term base case uses a moderate multiple because the steel industry remains cyclical even if Tata Steel increases capacity and improves its product mix.
These are selected scenario multiples, not calculated historical averages or official industry forecasts. EV/EBITDA, normalised earnings, net debt and return on invested capital should also be monitored as the projections are updated.
Key Factors That Could Drive Tata Steel Share Price
1. Indian steel demand and revenue growth
Infrastructure, housing, construction and automotive demand can increase volumes. The latest provisional Q2 FY2027 data showed Indian deliveries growing 7% year on year.
2. Capacity expansion and new projects
The Neelachal Ispat Nigam expansion and other Indian investments can improve production scale and product availability, provided demand and project returns justify the investment.
3. EBITDA margins and cost savings
Higher realisations, better product mix, raw-material costs and operating efficiency determine how much additional revenue becomes profit.
4. Debt reduction and cash generation
Sustained operating cash flow can support capital expenditure and reduce financial risk. Debt reduction is especially important because Tata Steel operates in a capital-intensive industry.
5. European operations and regulation
The performance of Tata Steel’s Netherlands and UK businesses can materially affect consolidated profitability. The Direct Sheet Plant restart in the Netherlands and UK market safeguards are relevant developments, but their financial benefits remain uncertain.
Promoter and institutional holding changes
Changes in promoter, FII/FPI and DII holdings can influence market sentiment and valuation. However, no specific latest shareholding change is asserted here without a verified current exchange filing. Shareholding trends should be checked against the latest NSE/BSE disclosures rather than inferred from price movements.
Risks to the Tata Steel Share Price Target
1. Macro & Commodity Cyclicality Risks
- Steel Price Volatility: Steel is a globally traded commodity vulnerable to deep macroeconomic shifts. If industrial production in major global economies slows down, international markets experience a supply glut. Excess foreign supply can lead to low-cost imports flowing into India, directly undercutting Tata Steel’s domestic Net Sales Realization (NSR) and compressing core margins.
- Raw Material Price Volatility: While Tata Steel enjoys structural cost protection in India through 100% captive iron ore mines, it remains highly exposed to global coking coal pricing. Coking coal is a critical blast furnace input that must be heavily imported. Sharp, unpredictable price spikes in seaborne coking coal can quickly erase the cost advantages gained from internal iron ore sourcing.
2. Balance Sheet & Execution Pressures
- The Capex vs. FCF Dilemma: Moving toward a domestic capacity target of 35–40 MTPA by 2030 requires substantial capital deployment. With a stepped-up capex plan approaching an annual run-rate of ₹20,000 crore, a significant portion of operating cash generation is locked up. If the commercialization of large projects faces delays, or if steel spreads narrow, the company risks generating negative Free Cash Flow. This pressure could pause its de-leveraging efforts and add weight to its absolute net debt burden (which stood at ₹80,144 crore at the close of FY2026).
- Execution Slippages: Megawatt-scale industrial projects face complex supply chain coordination, local regulatory approvals, and engineering hurdles. A delay in ramping up facilities, such as the 4.8 MTPA expansion at Neelachal Ispat Nigam Limited (NINL), prolongs the period where capital is tied up without generating operational returns, directly lowering the company’s near-term Return on Capital Employed (ROCE).
3. Structural Overheads: The European Drag
- Decarbonization Hurdles: Operating assets in the UK and the Netherlands face stringent regional environmental mandates. Transitioning aging legacy blast furnaces to low-emission Electric Arc Furnaces (EAF) or hydrogen-based DRI setups demands heavy, non-revenue-generating capital expenditure.
- Operating and Regulatory Risks: Alongside high energy costs in Europe, structural layout upgrades risk temporary production stops or localized labor restructurings. These disruptions compress consolidated EBITDA margins and dilute the strong returns generated by the company’s domestic Indian operations.
4. Valuation & Market Compression Risks
- The P/E Paradox: Equity markets rarely reward commodity producers with stable, linear valuation multiples. Even if Tata Steel delivers higher Earnings Per Share (EPS) via volume expansions, the market may compress its trailing P/E multiple if investors sense the broader metal cycle is nearing a peak. As highlighted in the scenario models, a multiple contraction from 17x down to 13x or 11x can drag the share price down significantly, even amidst stable operational performance.
Summary of Core Risk Interdependencies
Calculated using Google Finance data. Might be shortened for brevity.
| Risk Category | Primary Financial Metric Impacted | Strategic Vulnerability Trigger |
|---|---|---|
| Commodity Risk | EBITDA Margin / NSR | Volatile global coking coal costs & cheaper international steel imports. |
| Execution Risk | Return on Capital Employed (ROCE) | Delays or cost overruns at the NINL or Kalinganagar expansion sites. |
| Structural Risk | Consolidated Free Cash Flow | High green-transition capex and operational restructuring overheads in Europe. |
| Valuation Risk | Trailing P/E Multiple | Market-wide de-rating of cyclical stocks due to shifts in global macro cycles. |
Is Tata Steel a Long-Term Growth Story?
The question of whether Tata Steel (NSE:TATASTEEL, BOM:500470) qualifies as a long-term structural growth story depends on its transition from a cyclical commodity volume producer into an efficient, high-margin manufacturing enterprise. The historical performance of FY2026—characterized by a sharp surge in Profit After Tax (PAT) to ₹10,886 crore and a drop in the Net Debt/EBITDA leverage ratio to 2.3x—proves that the company’s “India-first” capital allocation pivot is yielding positive results.
However, long-term equity investors cannot rely on linear extrapolations of high-growth years. Evaluating this company across a full multi-year economic cycle requires tracking specific corporate metrics:
1. Key Value Metrics to Monitor
- Normalised EBITDA per Tonne: This is the most accurate indicator of underlying operational health. Evaluating total revenues can be distorted by broad swings in raw material values. Tracking the net profit generated per ton of shipped product isolates exactly how well Tata Steel’s high-value branded portfolios (like Tata Tiscon and automotive coated sheets) are protecting its margins from cheaper global imports.
- Operating Cash Flow After Capex (True Free Cash Flow): With a stepped-up domestic capital expenditure plan hovering near ₹20,000 crore annually to hit a targeted 35–40 MTPA footprint by 2030, headline Operating Cash Flow is not the final metric of health. True value creation depends on keeping post-capex Free Cash Flow positive, ensuring that expansions are self-sustaining and do not require heavy external borrowings.
- Marginal Return on Capital Employed (ROCE): Greenfield and brownfield expansions, such as the 4.8 MTPA crude steel expansion at Neelachal Ispat Nigam Limited (NINL), require massive upfront capital. Investors must watch whether these projects achieve their targeted domestic utilization rates swiftly upon commissioning to expand the company’s mid-cycle returns above its historical baseline (mid-October 2026 snapshot showed an ROCE of 12.5%).
2. Deconstructing the 2030 Base Case Valuation
The base-case valuation target of ₹263 by 2030 implies a healthy 50% upside from the mid-cycle trading price of ~₹175.60. However, this model is built on structured internal performance thresholds:
- Earnings Sustainability: It assumes that domestic infrastructure and manufacturing pipelines inside India absorb newly scaled production volumes smoothly, lifting sustainable forward EPS to ₹17.50 by 2030.
- Valuation Multiple Anchor: It relies on equity markets valuing this cash-flow stream at a stable, normalized long-term P/E multiple of 15x.
If global steel margins collapse or execution hurdles at domestic plant sites delay production scaling, the bear-case scenario indicates that multiple compression down to 11x could pull the target down to ₹132, highlighting a structural 25% downside risk. Conversely, hitting the optimistic ₹456 bull case requires a perfect macroeconomic landscape: zero operational delays, complete resolution of high green-transition costs in Europe, and premium market valuations (19x P/E).
Summary & Insights
Calculated using Google Finance data. Might be shortened for brevity.
| Multi-Year Scenario Horizon | Estimated Forward EPS | Assumed P/E Multiple | Implied Share Target | Potential Return vs. ₹175.60 Baseline |
|---|---|---|---|---|
| Bear Case (Downside Risk) | ₹12.00 | 11x | ₹132 | -25% |
| Current Baseline (Oct 2026) | — | 20.0x | ₹175.60 | Current Market Price |
| Base Case (Target 2030) | ₹17.50 | 15x | ₹263 | +50% |
| Bull Case (Optimistic Super-Cycle) | ₹24.00 | 19x | ₹456 | +160% |
Ultimately, Tata Steel presents a legitimate domestic growth narrative, but one that remains tied to a cyclical capital-intensive asset class. Volume growth alone will not unlock the 2030 targets; instead, the stock’s performance will depend on the management’s ability to maintain high margins on every extra ton of steel it brings to market.
Frequently Asked Questions
1. What is Tata Steel share price target for 2026?
The illustrative year-end 2026 targets are ₹119 in the bear case, ₹179 in the base case and ₹240 in the bull case. They are based on estimated FY2027 EPS and different P/E assumptions.
2. What is Tata Steel share price target for 2027?
The scenario targets are ₹124, ₹200 and ₹300 for the bear, base and bull cases, respectively. The base case assumes EPS of ₹12.50 and a P/E of 16x.
3. What is Tata Steel share price target for 2030?
The illustrative 2030 targets are ₹132 in the bear case, ₹263 in the base case and ₹456 in the bull case. The bull case requires stronger earnings and a higher valuation multiple than the base case.
4. What factors could affect Tata Steel share price?
Steel prices, Indian demand, production volumes, EBITDA margins, capacity expansion, raw-material costs, debt, European operations and market valuation can all influence its share price.
5. What valuation method is used for the Tata Steel share price target?
The primary method is estimated EPS multiplied by an assumed P/E multiple. The scenarios use different earnings and valuation assumptions to reflect uncertainty. EV/EBITDA and balance-sheet measures provide additional context.
6. What are the major risks to the Tata Steel share price target?
The main risks are steel-industry cyclicality, margin pressure, high capital expenditure, debt, project delays, competition and regulatory challenges in overseas operations.
Where are Tata Steel’s primary manufacturing operations located?
Tata Steel is a globally integrated steel producer with operations structured across three major regions:
India: The high-margin core of the business, anchored by primary integrated steelmaking plants in Jamshedpur (Jharkhand) and Kalinganagar (Odisha), alongside long-product facilities at Neelachal Ispat Nigam Limited (NINL).
Europe: Primarily consists of Tata Steel Netherlands (Ijmuiden) and Tata Steel UK (Port Talbot), which are currently undergoing structural overhauls to transition away from traditional blast furnaces.
Southeast Asia: Downstream and manufacturing operations handling specialized local distributions.
What are the key details of Tata Steel’s capacity expansion plans?
Tata Steel is executing an aggressive “India-First” expansion strategy, targeting a domestic crude steel capacity of 35–40 million tonnes per annum (MTPA) by 2030. A major component of this plan is the approved ₹33,873 crore expansion at NINL, which will scale that plant’s capacity up by 4.8 MTPA to reach a total of 6.2 MTPA. The capital is heavily directed toward high-margin downstream facilities, such as the newly commissioned coated and automotive steel lines at Kalinganagar.
How did Tata Steel perform financially in its latest audited full year?
Tata Steel experienced significant financial recovery and positive operating leverage in FY2026:
Revenue: Scaled to ₹2,32,140 crore (up ~6.2% from ₹2,18,543 crore in FY2025).
EBITDA: Surged ~35.1% to ₹34,848 crore, expanding its core EBITDA margin by 320 basis points to 15.0%.
Profit After Tax (PAT): Multiplied over three-fold to finish at ₹10,886 crore (up from ₹3,174 crore in FY2025).
De-leveraging: Absolute net debt was trimmed to ₹80,144 crore, dropping the company’s Net Debt/EBITDA credit leverage ratio to a much safer 2.3x.
What are the main risk factors threatening Tata Steel’s valuation?
As a commodity-based asset, Tata Steel faces several structural constraints:
Steel-Price Cyclicality: Sluggish global economic demand can depress regional margins and result in lower price realization.
Raw Material Costs: While 100% self-sufficient in iron ore within India, the company remains highly exposed to volatile global seaborne coking coal import costs.
The European Drag: Strict environmental regulations in Europe require heavy, non-revenue-generating capital expenditure to convert aging blast furnaces into eco-friendly Electric Arc Furnaces (EAF).
Capex Execution: Multi-billion rupee projects risk capital dilution if construction timelines face delays or cost overruns.
Source Quality Report
| Information | Source | Source type | Verified? |
|---|---|---|---|
| FY2026 revenue, EBITDA and PAT | Tata Steel FY2026 results | Primary | Yes |
| Debt, capex and strategy | FY2026 integrated report | Primary | Yes |
| Q1 FY2027 financial results | Official quarterly release | Primary | Yes |
| Q2 FY2027 provisional production | Official operating update | Primary | Yes |
| Market price and valuation ratios | Market-data snapshot | Secondary | Indicative; not exchange-verified |
| FY2027–FY2030 EPS and price targets | Scenario calculations in this analysis | Analyst assumptions | Not reported facts |
Data limitation: Current forward P/E, PEG, EV/EBITDA, industry-wide valuation averages and fully reconciled interest coverage were not established from the primary sources reviewed. No analyst-consensus EPS forecast is claimed in this analysis. Targets should be recalculated when final Q2 FY2027 results and updated market data become available.
Disclaimer: These share price targets are scenario-based estimates for educational and informational purposes only. They are not guaranteed price predictions or investment advice. Actual prices may differ materially depending on earnings, valuation, market conditions and company-specific developments.
1 thought on “Tata Steel Share Price Target 2026, 2027, 2030”