

Table of Contents
Analysis date: 20 October 2026 | NSE: APOLLOHOSP | BSE: 508869
Apollo Hospitals Enterprise Limited is one of India’s leading integrated healthcare companies, with operations spanning hospitals, pharmacies, digital healthcare and other health services. Its future share price will depend on hospital expansion, patient volumes, profitability, digital-business performance and the valuation investors are willing to pay for its earnings.
Tata Steel Share Price Target 2026, 2027, 2030
Cupid Share Price Target 2026, 2027, 2030
Mahindra & Mahindra Share Price Target 2026, 2027, 2030
This analysis estimates the Apollo Hospitals share price target for 2026, 2027 and 2030 using earnings-based valuation scenarios rather than assuming that past share-price growth will continue.
The latest market-price reference I could verify was ₹7,700 on 19 October 2026, the previous trading session. The targets below are independent illustrative estimates, not official company guidance or broker consensus.
Apollo Hospital Share Price Target 2026
Financial Growth vs. Premium Valuation
Apollo Hospitals’ target prices are anchored by strong financial growth. In Q1 FY27, the company achieved an impressive 21% year-on-year revenue growth and a 28% jump in EBITDA, resulting in an Earnings Per Share (EPS) of ₹40.40 for the quarter.
While these figures solidify earnings growth as a fundamental driver for the stock, the analysis highlights a critical risk: premium valuation. Because the stock trades at a high price-to-earnings (P/E) multiple, excellent business performance is already partially priced in. Consequently, strong operational numbers might not directly lead to substantial stock price gains if the market decides to compress its valuation multiple.
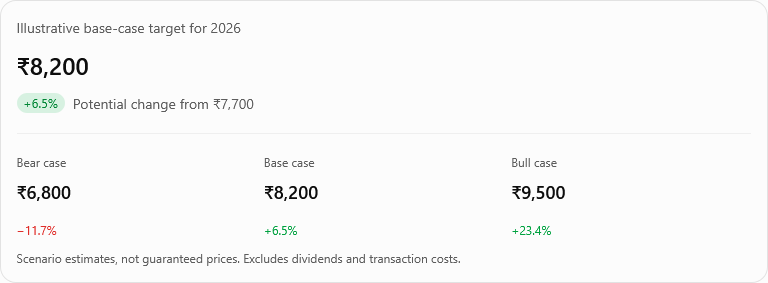
2026 Share Price Target Scenarios
- Bull Case (₹9,500): This optimistic scenario assumes that hospital revenue and profitability comfortably beat market expectations. In this case, investors remain confident and continue to reward the company with a premium valuation multiple.
- Base Case (₹8,200): The most likely scenario where earnings maintain a steady upward trajectory and existing hospitals deliver solid metrics. Here, the premium stock valuation is expected to cool down and moderate gradually over time.
- Bear Case (₹6,800): The pessimistic outlook where earnings growth decelerates, newly opened hospitals take longer than anticipated to break even, or broader market sentiment drives down Apollo’s P/E multiple.
Apollo Hospital Share Price Target 2027
| Scenario | 2027 target | Illustrative FY28 EPS | Assumed P/E |
|---|---|---|---|
| Bear case | ₹7,300 | ₹185 | 39.5x |
| Base case | ₹9,300 | ₹200 | 46.5x |
| Bull case | ₹11,200 | ₹210 | 53.3x |
Financial Analysis & Projections
The provided analysis outlines the 2027 share price targets for Apollo Hospitals Enterprise Limited (INDEXNSE:NIFTY_PHARMA) based on different operational and valuation scenarios. The stock’s performance depends heavily on structural capacity expansion and valuation multiples.
The targets are calculated using illustrative Fiscal Year 2028 (FY28) Earnings Per Share (EPS) projections multiplied by an assumed Price-to-Earnings (P/E) ratio:
- Bear Case (₹7,300): Assumes slower operational growth resulting in an illustrative FY28 EPS of ₹185. Due to execution delays or lower occupancy, the market compresses the valuation multiple down to 39.5x. From the reference price of ₹7,700, this implies a potential downside of approximately 5.2%.
- Base Case (₹9,300): Assumes steady business progression with an illustrative FY28 EPS of ₹200. The target is derived using a moderated valuation multiple of 46.5x (
₹200×46.5=₹9,300). Compared to the reference price of ₹7,700, this target represents a potential upside of roughly 20.8%.
- Bull Case (₹11,200): Assumes strong execution on bed utilization and high patient demand, yielding a higher illustrative FY28 EPS of ₹210. Investor confidence remains robust, sustaining a premium P/E multiple of 53.3x.
Key Growth Drivers and Risks
- Capacity Expansion: The core long-term thesis relies on Apollo’s plan to scale its footprint to approximately 14,100 beds by FY31.
- Short-Term Revenue Velocity: Management has targeted hospital revenue growth of around 20% for FY27. Meeting this target acts as a critical checkpoint for the multi-year trajectory.
- Execution Risks: Reaching these price targets depends entirely on real-world variables, including average bed occupancy rates, medical staffing costs, and how quickly newly built facilities can optimize operations to reach profitability.
- Valuation Sensitivity: Because the stock has historically traded at a premium, any broader market correction or failure to sustain high growth could result in valuation compression, dragging the stock down even if nominal earnings continue to rise.
Apollo Hospital Share Price Target 2030
1. Structural Growth Drivers
Apollo’s long-term upside is driven by both demographic tailwinds and corporate scaling:
- Capacity & Maturation: Building hospitals requires significant upfront capital expenditure (CapEx). As newer facilities mature, occupancy rates rise, allowing the company to recover fixed costs and expand operating margins.
- Optimized Case Mix: Profitability improves when a higher proportion of treatments are specialized, complex procedures (e.g., oncology, cardiology, neurology), which command better margins than basic clinical treatments.
- Digital & Ecosystem Expansion: Beyond physical beds, growth is increasingly tied to its digital healthcare ecosystem (Apollo 24/7), diagnostic labs, and retail pharmacy networks, which scale efficiently without the heavy real estate drag of mega-hospitals.
2. Operational and Macro Risks
These growth levers must counteract formidable headwinds:
- High CapEx & Capital Drag: Constructing state-of-the-art facilities is expensive and dilutes short-term returns on capital until occupancy stabilizes.
- Talent Scarcity: Attracting and retaining top-tier clinical talent and medical professionals drives up operational expenses (employee costs).
- Market Competition: The Indian healthcare landscape is highly competitive, with aggressive expansions from other large hospital networks and corporate entrants.
3. Deconstructing the Base Case Valuation Model
The text introduces a specific valuation framework for fiscal year 2030 (FY30):
- Projected Earnings (EPS of ₹280): This assumes that Apollo will significantly scale its net profitability over the next few years, fueled by its operational efficiencies and digital services.
- Contraction of the P/E Multiple (40x): Historically, Apollo Hospitals has traded at high trailing Price-to-Earnings (P/E) multiples due to its market leadership and high growth premium. The model conservatively scales this back to a 40x multiple by 2030, reflecting a maturing business profile where growth stabilizes.
- Target Price Calculation: Multiplying the projected ₹280 EPS by the 40x P/E multiple yields the estimated share price target of ₹11,200.
4. Scenario Planning (Bull vs. Bear)
Because long-term forecasting is highly speculative, investors use multi-scenario frameworks rather than relying on a single price target:
- Bull Case: Achieved if Apollo scales its digital health platform faster than expected or sees stronger margin expansion, allowing it to sustain its historical premium valuation multiple alongside high earnings.
- Bear Case: Occurs if competitive pressures trigger a price war, or if capital expansions stall, dragging down earnings growth and leading to a sharp contraction in its valuation multiple.
Apollo Hospital Share Price Target 2026, 2027, 2030: Bull vs Base vs Bear
The consolidated table below summarises the illustrative Apollo Hospitals stock price target for each year. The EPS estimates and valuation multiples are my scenario assumptions, not published company targets.
| Year | Bear case | Base case | Bull case | Main assumption |
|---|---|---|---|---|
| 2026 | ₹6,800 | ₹8,200 | ₹9,500 | FY27 earnings and near-term valuation |
| 2027 | ₹7,300 | ₹9,300 | ₹11,200 | FY28 earnings growth and expansion |
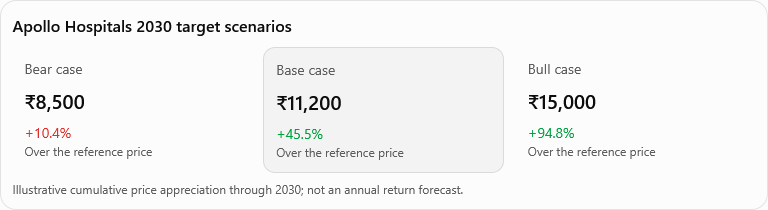
| 2030 | ₹8,500 | ₹11,200 | ₹15,000 | Long-term earnings growth and valuation |
Reference price: ₹7,700 as of the 19 October 2026 close. Potential returns shown in the earlier sections are price-only estimates and exclude dividends.
Business and growth analysis
Diversified Healthcare Ecosystem
Apollo does not operate simply as a hospital chain; it is an integrated healthcare platform:
- Hospitals (Core Engine): This remains the primary profit center. Profitability here is highly sensitive to fixed-cost absorption. If beds sit empty, fixed overheads (surgeons, equipment, electricity) compress margins.
- Pharmacy & Distribution: This segment provides stable, high-volume retail cash flows that contrast with the cyclical or lumpy revenue nature of elective surgeries.
- Digital Healthcare (Apollo 24/7): This serves as a modern patient-acquisition funnel, connecting digital consultations and diagnostic bookings directly back to Apollo’s physical hospitals and pharmacies.
Deep Dive Into the Key Growth Drivers
- Hospital Expansion (The CapEx J-Curve): When Apollo builds a new hospital, it experiences a financial “J-Curve.” Significant upfront capital is deployed, and initial quarters often show losses due to high depreciation and staff onboarding costs. True profitability only kicks in once the facility hits a “mature occupancy” threshold (typically above 60–65%).
- Higher-Value Medical Treatments (Case Mix Optimization): Not all hospital beds generate equal returns. A patient undergoing a complex organ transplant or robotic oncology surgery (high-value case mix) generates significantly higher revenue and margins per operating room hour than a patient admitted for general medicine.
- Existing Hospital Utilisation (Operating Leverage): This is the most efficient way for Apollo to expand margins. Once a hospital’s fixed costs are covered, almost every additional rupee generated from higher occupancy or faster turnaround times in operating theaters drops straight to the bottom-line profit.
- Pharmacy & Digital Healthcare (Profitability vs. Scale): Digital health platforms and rapid retail expansions are notorious for burning cash to acquire market share. The analysis rightly cautions investors to look past “top-line (revenue) growth” and scrutinize standalone profitability, cash burn rates, and return on capital in these digital segments.
- Industry Demand vs. Execution: While macro tailwinds in India—such as an aging population, rising middle-class incomes, and a gap in quality healthcare infrastructure—ensure a expanding market, corporate execution is what differentiates winners. Poorly managed expansions or localized price wars can still erode shareholder returns despite favorable industry tailwinds.
Investor Source Verification
The text emphasizes relying on primary investor-relations documents. Key metrics to track in quarterly earnings-call transcripts and presentations include:
Occupancy Rates: The percentage of operational beds currently in use.
ARPOB: Average Revenue Per Occupied Bed (tracks case mix premium).
ALOS: Average Length of Stay (lower is often better, signaling higher patient turnover and asset efficiency).
Capacity expansion and management outlook
1. Scaling Capacity: The 14,100 Bed Target by FY31
- The Aggressive Blueprint: Apollo intends to scale its census bed capacity to approximately 14,100 beds by fiscal year 2031. This translates to adding over 5,800 new beds over a five-year period.
- Expansion Strategy: The expansion relies on a mix of strategic new builds in high-demand micro-markets (such as the North and West regions) along with cost-efficient brownfield expansions (adding beds to existing hospital units).
- Balance Sheet Health: A key positive highlighted by management is that this massive expansion will be funded predominantly via internal accruals rather than aggressive debt financing, preserving a comfortable leverage position on the balance sheet.
2. High Near-Term Revenue Visibility (20% FY27 Outlook)
- Upgraded Guidance: Following strong operational momentum, Apollo’s management raised its FY27 hospital revenue growth guidance to around 20% (up from an earlier forecast of mid-teens).
- Underlying Drivers: This high-velocity growth is supported by an increase in premium surgical case mixes (specifically high-acuity “CONGO-T” specialties like Cardiac, Oncology, Neuro, Gastro, Ortho, and Transplants), rising inpatient volumes, and solid occupancy rates hovering around 70%.
3. Execution Risks to the Share Price Forecast
While a 20% near-term growth runway and scaled capacity are highly bullish signals, the long-term share price forecast depends entirely on managing the execution pipeline:
- The Drag of “New” Capacities: New hospital facilities carry gestation periods that act as a drag on short-term corporate profitability. Management anticipates losses from newly commissioned facilities (such as the upcoming Gurgaon facility) to peak around ₹150 crore for FY27.
- Staffing & Talent Acquisition: Adding thousands of beds requires recruiting a proportional army of specialized doctors, nursing staff, and technicians. If wage inflation fields higher employee expenses, it can eat into the operating leverage benefits.
- Utilization Turnaround: The ultimate return on invested capital (ROIC) hinges on how quickly Apollo can ramp up bed occupancies in these new markets to cross the profitability threshold.
Apollo Hospitals financial performance
The latest company financial results available in the sources reviewed include FY26 audited results and Q1 FY27 unaudited results. The following figures distinguish reported performance from estimates.
FY26 and Q1 FY27 snapshot
Consolidated figures; ₹ crore unless otherwise specified.
| Metric | FY26 | Q1 FY27 |
|---|---|---|
| Revenue | Approximately ₹25,200 crore | Approximately ₹7,044 crore |
| EBITDA | Approximately ₹3,770 crore | Approximately ₹1,092 crore |
| EBITDA margin | Approximately 15.0% | Approximately 15.5% |
| PAT | Approximately ₹1,960 crore | Quarter-specific PAT should be checked against the official filing |
| EPS | Full-year figure requires reconciliation with the reported diluted EPS basis | Approximately ₹40.40 |
FY26 revenue, EBITDA and PAT figures are rounded summaries of reported performance. Q1 FY27 figures are based on the available earnings summary; readers should consult the official financial statement for exact reported versus adjusted figures.
What do the results indicate?
The available earnings summary indicates that revenue and EBITDA grew faster in Q1 FY27 than in the corresponding prior-year period. That is a positive operating signal.
However, consolidated results combine different businesses with different margin profiles. Hospital EBITDA margins can be substantially higher than those of pharmacy distribution, so the group-level margin should not be confused with hospital-only profitability.
For a complete investment analysis, the following metrics also matter:
- Operating cash flow: Whether reported profits translate into cash generated by operations.
- Free cash flow: Whether operating cash flow is sufficient to fund expansion after capital expenditure.
- ROE and ROCE: How efficiently shareholder capital and total operating capital generate returns.
- Debt-to-equity and interest coverage: The financial risk associated with expansion funding and borrowing costs.
- Diluted EPS: The correct basis for translating earnings into a per-share valuation.
I could not independently reconcile all these metrics to exact, consistently defined figures from the accessible source extracts. They should be checked against the FY26 annual report and Q1 FY27 filing before publication as verified financial ratios.
Apollo Hospitals valuation analysis
The stock’s valuation is central to any Apollo Hospitals share price target. A high-quality company can still deliver disappointing returns if its share price already reflects optimistic growth expectations.
A secondary financial-data comparison dated 15 October 2026 reported the following valuation snapshot.
| Valuation metric | Apollo Hospitals | Interpretation |
|---|---|---|
| Trailing P/E | Approximately 54.6x | Premium earnings valuation |
| Price-to-book | Approximately 11.8x | High valuation relative to accounting book value |
| Market capitalisation | Approximately ₹1.14 lakh crore | Large-cap healthcare company |
| ROE | Approximately 22.7% | Strong reported return on equity |
| Peer P/E: Max Healthcare | Approximately 57.3x | Similar premium valuation |
| Peer P/E: Fortis Healthcare | Approximately 53.5x | Comparable valuation |
| Peer P/E: Narayana Hrudayalaya | Approximately 43.2x | Lower multiple in this comparison |
These are secondary-provider figures, not exchange-certified calculations. Different providers may report different P/E ratios depending on the earnings period, adjustments and date used.
Is Apollo Hospitals expensive or reasonably valued?
Apollo Hospitals appears expensively valued in absolute terms, with a trailing P/E above 50x in the cited snapshot. Its valuation is broadly comparable with some large hospital peers, but this does not by itself establish that the stock is cheap or expensive relative to future earnings.
The most important questions are:
- Can earnings grow quickly enough to support the current multiple?
- Will hospital expansion generate adequate returns on invested capital?
- Can the company improve cash generation while funding expansion?
- Will investors continue to pay a premium for its healthcare platform?
A lower P/E in a future year could arise because earnings grow while the share price rises more slowly. Conversely, a falling share price could reduce the multiple for the wrong reason: deteriorating earnings expectations.
Forward P/E, PEG and EV/EBITDA should be calculated using a consistent, dated set of earnings and enterprise-value assumptions. I have not presented them as verified current metrics where those inputs could not be independently reconciled.
How we calculated the Apollo Hospital share price target
The basic method is:
\[ \text{Target Price}=\text{Estimated EPS}\times\text{Assumed P/E} \]
This method estimates the value of a share based on future earnings per share and the valuation investors might assign to those earnings.
Base-case calculation
| Year | Illustrative EPS | Assumed P/E | Calculated target |
|---|---|---|---|
| 2026 | ₹170 | 48.2x | ₹8,194, rounded to ₹8,200 |
| 2027 | ₹200 | 46.5x | ₹9,300 |
| 2030 | ₹280 | 40.0x | ₹11,200 |
The FY27 EPS assumption of ₹170 is broadly consistent with annualising the reported Q1 FY27 EPS of approximately ₹40.40, while recognising that actual quarterly earnings can vary. The FY28 and FY30 figures are scenario assumptions, not analyst consensus.
The FY30 assumption implies EPS growth of approximately 18% annually from ₹170 to ₹280 over four years. This is an ambitious but illustrative growth path; it requires sustained business expansion and profitable execution.
The multiples used in the base case decline over time to reflect the possibility that the market will demand a more moderate valuation as the company matures. They are not forecasts of the exact P/E Apollo will trade at in those years.
Bull, base and bear assumptions
| Input | Bear case | Base case | Bull case |
|---|---|---|---|
| Earnings growth | Slower than assumed | Sustained growth | Faster execution and growth |
| Hospital expansion | Delays or weak utilisation | Gradual capacity ramp-up | Strong utilisation and execution |
| Margins | Pressure from operating costs | Broadly stable or improving | Better operating leverage |
| Valuation multiple | Significant compression | Gradual compression | Premium valuation sustained |
| Main risk | Lower EPS and P/E | Execution against plan | Expectations become too optimistic |
The 2026 target also deserves a timing qualification: as of 20 October, much of calendar 2026 has elapsed. The 2026 estimates are near-term scenario values rather than a full-year investment-return forecast.
Key factors that could drive Apollo Hospital share price Target
1. Revenue & Margin Dynamics (The Core Hospital Business)
- Operating Leverage: The interplay between revenue growth and operating margins is critical. Because hospitals are heavily burdened with fixed costs (depreciation of high-end equipment, structural overheads), a minor uptick in utilization or occupancy rates can trigger a substantial jump in earnings per share (EPS).
- The Margin Headwinds: Conversely, margin expansion is strictly bounded by two major cost pools—staff costs (retaining highly compensated clinical professionals) and gestation drag (losses incurred by new facilities before they reach breakeven occupancy). Efficient cost control over these lines is vital to sustain the stock’s premium valuation.
2. Execution vs. Dilution in Capacity Expansion
- While adding new beds expands the company’s total revenue capacity, the stock market heavily penalizes inefficient capital deployment.
- If new projects suffer execution delays or struggle to attract patients, the resulting rise in capital expenditure (CapEx) can drag down the company’s Return on Invested Capital (ROIC), compressing the stock’s valuation multiple.
3. The Digital Health & Pharmacy Catalysts
- Apollo HealthCo (encompassing digital health platform Apollo 24/7 and the pharmacy network) has traditionally been evaluated as a high-revenue, cash-burning growth engine.
- A structural pivot toward sustainable, standalone profitability in this digital segment acts as a potent catalyst for the consolidated stock, as it eliminates cash drag and adds a scalable tech-premium to a brick-and-mortar hospital business model.
4. Cash Flow, Capital Allocation, and Flexibility
- The business must generate robust operating cash flows relative to its capital expenditures. Free Cash Flow (FCF) generation gives Apollo the financial flexibility to fund its massive capacity targets (such as its 14,100-bed objective) through internal cash generation, minimizing high-interest debt accumulation and equity dilution.
5. Market Microstructure & Regulatory Realities
- Institutional Flows: As a large-cap stock, Apollo’s price movements are strongly correlated with institutional sentiment. Sustained buying by Foreign Institutional Investors (FIIs) and Domestic Institutional Investors (DIIs) builds a valuation floor under the stock.
- Regulatory Caps: The healthcare sector remains highly exposed to regulatory intervention. Any mandates from statutory bodies concerning price caps on medical implants, clinical procedures, room rents, or changes to insurance reimbursement structures pose immediate risks to projected earnings.
Risks to the Apollo Hospital share price target
1. The Trap of Premium Valuations
- Multiple Compression: When a stock trades at a Price-to-Earnings (P/E) multiple above 50x, the market is pricing in near-flawless execution and high-velocity earnings growth. If growth transitions from “exceptional” to merely “good” (e.g., dipping from 25% to 15%), the stock price can experience a sharp correction even while earnings continue to rise. This happens because institutional investors downgrade the multiple they are willing to pay, compressing a 60x P/E down to 40x.
- Macro Market Shifting: High P/E growth stocks are highly sensitive to global liquidity and interest rate cycles. In a high-interest-rate environment or a broad market downturn, capital frequently rotates out of premium-valued entities into defensive sectors, depressing the share price regardless of Apollo’s internal performance.
2. Capital Execution and the “Growth Drag”
- The Gestation Lag: A target like Apollo’s objective of ~14,100 beds by FY31 requires heavy upfront capital deployment. A risk is that new greenfield hospitals take longer than the typical 2–3 years to break even on an operating level.
- The Paper Profit Illusion: A disconnect often forms between Net Profit (accounting profit) and Free Cash Flow (FCF). If Apollo’s operating cash flows are completely consumed by ongoing construction costs and equipment purchases, its FCF turns negative. A company starved of free cash flow has less financial flexibility to pay dividends, buy back shares, or weather economic downturns, which institutional models penalize.
3. Supply-Side Cost Pressures
- Talent Bidding Wars: The hospital business is built on human capital. Apollo competes directly with chains like Max Healthcare, Fortis, and global health hubs for top-tier surgeons and clinical talent. Attracting these professionals requires aggressive compensation packages, escalations in staff costs, and a higher cut of surgical revenues, directly eroding corporate operating margins.
- Tech and Infrastructure Creep: Maintaining a premium brand requires ongoing reinvestment in expensive medical technologies (like DaVinci robotic surgery systems or advanced proton therapies). These investments carry high depreciation costs that chip away at net margins.
4. Regulatory and Ecosystem Volatility
- The Risk of Price Caps: Healthcare in India is socially and politically sensitive. Statutory interventions—such as capping the prices of cardiac stents, knee implants, essential drugs, or room rents—can alter operating models overnight, turning highly profitable procedures into low-margin lines.
- Digital Cash Burn: While platforms like Apollo 24/7 drive substantial top-line revenue growth and customer acquisition, they demand continuous cash infusions for digital marketing, app maintenance, and technological infrastructure. If these digital ecosystems fail to transition into self-sustaining profit centers, they will remain a structural drag on consolidated corporate cash flows.
Is Apollo Hospitals a long-term growth story?
1. Structural Strengths vs. Price Vulnerability
- The Moat: Apollo’s status as a premier Indian healthcare brand, paired with its integrated ecosystem (hospitals, retail pharmacies, diagnostics, and digital apps), gives it a distinct competitive advantage. Favorable macro tailwinds—like a rising middle class and increasing health insurance penetration—provide secular demand visibility.
- The Valuation Gap: While the underlying business exhibits healthy revenue and EBITDA momentum, the stock often trades at a significant premium relative to standard equity markets. When a stock prices in multi-year growth well in advance, it creates an asymmetrical risk-reward profile: any slight operational delay can trigger steep multiple compression, while perfect execution may only justify the current price rather than driving outsized returns.
2. The Core Institutional Framework
To evaluate whether future earnings growth will absorb today’s premium valuation, institutional models focus on specific operational indicators:
- Asset Productivity (Occupancy & Bed Utilisation): Investors must track how fast newly added beds reach optimal occupancy (65%+). Efficient onboarding translates directly into higher operating margins via asset-light operating leverage.
- Quality of Income (Diluted EPS & Operating Cash Flow): High accounting profits can look attractive on paper, but sustainable growth requires strong operating cash flows to fund expansion natively. If capital expenditure structurally outpaces cash generation, it forces reliance on debt, diluting capital efficiency.
- Relative Multiples (Peer Benchmarking): Apollo’s performance cannot be viewed in a vacuum. Its valuation multiples (P/E, EV/EBITDA) must be continuously benchmarked against sector peers (e.g., Max Healthcare, Fortis Healthcare, Narayana Hrudayalaya) to see if its premium to the industry is expanding or contracting.
3. Conclusion on the 2030 Base Case
The referenced ₹11,200 price target for 2030 serves as a mathematical simulation based on a specific set of assumptions (₹280 EPS at a normalized 40x P/E multiple) rather than a fixed prediction. In hyper-growth economies like India, long-term targets are dynamic targets. The investment thesis remains valid only as long as quarterly earnings trends consistently track toward that underlying earnings run rate without sacrificing return on capital.
Frequently asked questions
1. What is Apollo Hospital share price target for 2026?
The illustrative 2026 targets are ₹6,800 in the bear case, ₹8,200 in the base case and ₹9,500 in the bull case. These estimates use a reference price of ₹7,700 from 19 October 2026.
2. What is Apollo Hospital share price target for 2027?
The illustrative 2027 targets are ₹7,300 in the bear case, ₹9,300 in the base case and ₹11,200 in the bull case. The estimates depend on FY28 earnings and the P/E multiple assigned by the market.
3. What is Apollo Hospital share price target for 2030?
The illustrative 2030 targets are ₹8,500 in the bear case, ₹11,200 in the base case and ₹15,000 in the bull case. The base case assumes FY30 EPS of ₹280 and a 40x P/E multiple.
4. What factors could affect Apollo Hospital share price?
Revenue growth, hospital occupancy, earnings per share, operating margins, expansion costs, cash flow, competition, regulatory developments and the market’s valuation of healthcare companies could all affect the share price.
5. What valuation method is used for the Apollo Hospital share price target?
The principal method is estimated EPS multiplied by an assumed P/E multiple. The analysis uses different earnings and valuation assumptions for bear, base and bull scenarios.
6. What are the major risks to the Apollo Hospital share price target?
The major risks include valuation compression, slower earnings growth, delayed hospital expansion, margin pressure, high capital expenditure, competition and regulatory changes. Actual returns may differ materially from the scenario estimates.
1. What are Apollo’s long-term capacity growth targets?
Apollo Hospitals targets reaching an overall census bed capacity of approximately 14,100 beds by fiscal year 2031 (FY31). This long-term blueprint involves scaling up by over 5,800 new beds from its current footprint using a strategic mix of new greenfield builds and brownfield expansions.
2. What is management’s near-term revenue guidance?
For the full fiscal year 2027 (FY27), Apollo’s management has guided for a hospital revenue growth outlook of around 20%. This reflects an upgraded expectation driven by rising inpatient volumes, higher bed occupancies (~70%), and an increasing share of complex, high-acuity surgical cases.
5. What are the key business divisions under the Apollo umbrella?
Apollo operates a diversified, omni-channel healthcare platform structured across:
Healthcare Services: Physical multi-specialty corporate hospitals.
Apollo HealthCo: Combining the physical retail pharmacy networks, health distribution channels, and the Apollo 24/7 digital healthcare platform.
Apollo Health & Lifestyle: Diagnostics labs, day surgery centers, and cradle/cradle-adjacent specialty formats.
What is the average length of stay (ALOS) across Apollo hospitals?
Across Apollo Hospitals’ network, the average length of stay (ALOS) for inpatients trends at approximately 3.15 to 3.20 days.
According to their late-FY26 operational performance updates, the continuous reduction in ALOS (which dropped from around 3.3 days to 3.19 days) has been driven by:
Technology Adoption: Significant expansion in the use of robotics and advanced minimally invasive surgical systems (e.g., DaVinci surgical platforms).
Operational Protocols: Implementation of enhanced recovery routes, standardized clinical pathways, and optimized discharge protocols across their network.
What is Apollo’s average revenue per occupied bed (ARPOB)?
As of the recent Q1 FY27 financial updates, Apollo Hospitals’ overall Average Revenue Per Occupied Bed (ARPOB) is approximately ₹67,000 per day.
Growth Trend: This reflects steady continuous growth from the ₹60,588 per day level in FY25, fueled by a 3% to 4% tariff revision and a structural shift in the case mix toward high-complexity specialty treatments (such as robotic, oncology, and organ transplant surgeries).
ARPP Metric: Driven by this robust ARPOB realization, Apollo’s Average Revenue Per Patient (ARPP) rose 8% year-on-year to ₹186,630 for the same quarter.
Source quality report
The following table distinguishes primary company disclosures from secondary market-data sources used in this analysis.
| Information | Source | Source type | Verification status |
|---|---|---|---|
| FY26 and Q1 FY27 results | Apollo Hospitals investor relations | Primary | Official results are available; exact figures should be checked in the filings |
| Annual report | Apollo Hospitals annual reports | Primary | Official FY26 report listed |
| Market-price reference | Investing.com historical prices | Secondary | ₹7,700 reported for 19 October 2026 |
| Valuation and peer comparison | Value Research peer comparison | Secondary | Dated snapshot available for 15 October 2026 |
| Earnings and expansion outlook | Company earnings materials | Primary company materials, supplemented by an earnings summary | Guidance should be checked against the official transcript |
| Future EPS and share-price targets | Scenario calculations in this article | Analyst assumptions | Illustrative only; not official targets |
Data limitation: I could not independently verify every requested ratio, including exact free cash flow, interest coverage, forward P/E and FY27–FY30 consensus EPS, from the accessible source extracts. Those figures have therefore not been presented as verified facts. The future EPS estimates and price targets are explicitly identified as scenario assumptions.
Disclaimer: These share price targets are scenario-based estimates for educational and informational purposes only. They are not guaranteed price predictions or investment advice. Actual prices may differ materially depending on earnings, valuation, market conditions and company-specific developments.
1 thought on “Apollo Hospital Share Price Target 2026, 2027, 2030”