
Table of Contents
Bajaj Housing Finance Share Price Target 2026, 2027, 2030
Analysis date: October 2, 2026 | NSE: BAJAJHFL | BSE: 544252
Bajaj Housing Finance is a housing finance company focused on home loans, loans against property, and financing for real estate developers. Its growth potential depends on housing credit demand, loan-book expansion, funding costs, asset quality, and the ability to sustain profitability as competition increases.
MCX Gold Price Today | Gold Rate Today
Exide Share Price Target 2026, 2027, 2030
Tata Motors Share Price Target 2026, 2027, 2030
The analysis below uses the latest available Q1 FY27 information and scenario-based valuation assumptions. The targets are calculated estimates, not official company guidance or guaranteed predictions.
Block Deals NSE Today | Bulk Deal NSE
Bajaj Housing Finance business and growth outlook
Business model
The business model of Bajaj Housing Finance Limited (NSE:BAJAJHFL) is structured as a low-risk, highly scalable retail mortgage framework. Beyond the product categories mentioned, the model thrives on several key strategic drivers:
1. Customer Target Market (Prime Focus)
- Salaried Individuals: To maintain exceptional asset quality, the retail business heavily targets the mass affluent salaried segment. Home loan customers generally average an annual income of ₹13 lakh and possess high CIBIL scores (often >750).
- Low Risk Over Yield: By focusing primarily on prime and upper-middle segments rather than high-risk, high-yield subprime portfolios, the company achieves an industry-leading Gross NPA of just 0.29% as of June 30, 2026.
2. Sourcing & Ecosystem Advantage
- The Bajaj Group Network: BAJAJHFL significantly lowers its customer acquisition costs by cross-selling to the massive 88+ million customer franchise of its parent company, Bajaj Finance Limited (NSE:BAJFINANCE).
- Developer Sourcing Funnel: Offering developer finance is not just a commercial product; it serves as a critical sourcing tool. Sponsoring real estate construction provides the company direct, friction-free access to prospective retail home buyers within those Approved Project Funds (APF).
3. Balanced Yield and AUM Optimization
- Anchor Products vs. High Yield: While prime home loans act as scale-builders with massive volume, they carry thin margins. The model relies on commercial segments like Lease Rental Discounting (LRD) and a measured expansion into Affordable Housing (targeting yields up to 13%) to push up overall return on equity (RoE).
- Liability & Borrowing Mix: As a non-deposit-taking HFC, the company balances its cost of funds by sourcing capital from a strategic mix of money markets, banks, and National Housing Bank (NHB) funding lines.
4. Operational Efficiency Through Tech
- The company deploys heavily digitized lending platforms (such as DIY online applications) to optimize turnaround times, enabling a low operating expense ratio (Opex-to-Net Total Income sat at 19.6% in Q1 FY27).
Key growth drivers
The strategic growth drivers for Bajaj Housing Finance Limited (NSE:BAJAJHFL) build upon its parent group’s established advantages to deliver long-term expansion. Here is an elaboration on how each factor acts as a growth driver:
1. Market Expansion & Geographic Penetration
- India’s Macro Housing Tailwinds: India’s housing-credit market continues to benefit from rapid urbanization, rising disposable incomes, and the government’s focus on affordable housing initiatives.
- Branch Network Scaling: By steadily scaling its presence across 182+ locations, the company expands its retail footprint. It enters tier-2 and tier-3 markets, converting localized housing demands into structural assets under management (AUM) growth.
2. Diversified Product Mix (Home Loans & LAP)
- Dual Engines of Growth: While standard prime Home Loans provide consistent volume, high-grade Loans Against Property (LAP) offer slightly higher yields. Balancing these two products allows the company to scale its book efficiently while managing total portfolio profitability.
3. Institutional Sourcing Pipeline via Developers
- Approved Project Funds (APFs): Developing commercial ties with creditworthy real estate developers serves as a B2B project platform that directly unlocks retail customer sourcing. Getting a developer’s project approved early gives the company exclusive or preferential access to retail homebuyers looking for instant project financing.
4. Operational Efficiencies & Operating Leverage
- Lower Operating Costs: As the overall loan book grows, fixed administrative, tech, and compliance costs get spread across a larger pool of interest-earning assets. Digitized credit-underwriting workflows and low Turnaround Times (TAT) help improve the company’s cost-to-income metrics as scale expands.
5. Group Ecosystem & Cost-Efficient Cross-Selling
- The Captive Franchise Advantage: Instead of relying entirely on external direct marketing agents, BAJAJHFL taps directly into the 88+ million customer database of Bajaj Finance Limited (NSE:BAJFINANCE). This lowers customer acquisition costs (CAC) significantly. It also leverages the prestige and trust of the broader Bajaj brand to secure low-cost market borrowings, enhancing net interest margins.
Industry outlook
The industry outlook for the housing finance sector and the metrics used to evaluate lenders like Bajaj Housing Finance Limited (NSE:BAJAJHFL) focus on specialized credit indicators:
1. Macro Sector Tailwinds vs. Economic Headwinds
- Structural Growth Drivers: Urbanization and the trend toward nuclear household formation act as steady long-term catalysts. With mortgage penetration in India remaining significantly lower than in developed economies, the addressable market offers multi-decade headroom.
- Cyclical Cyclones: The growth trajectory remains sensitive to fluctuations in the interest rate cycle. High policy repo rates can squeeze Net Interest Margins (NIMs) if the increased cost of funds cannot be smoothly passed to home buyers, or it can dent demand by hurting property affordability.
- Competitive Intensity: The sector is a high-volume battlefield where large public and private sector banks aggressively deploy capital. Housing Finance Companies (HFCs) must leverage unique sourcing ecosystems to defend their market share without compromising loan yields.
2. Loan Growth vs. Manufacturing Metrics
- Why Lending Differs: Unlike traditional industrial or manufacturing businesses, an HFC does not scale via physical manufacturing plants or explicit order backlogs. Instead, capital is the inventory, and loans are the product.
- AUM Growth as Volume: The total Assets Under Management (AUM) serves as the primary gauge of scale, reflecting how fast the lender is expanding its cumulative loan book.
- Branch Infrastructure: Physical and digital branch expansions into tier-2 and tier-3 locations replace traditional factory additions, acting as the distribution funnels to source fresh demand.
3. Funding Availability & Financial Health
Underwriting Quality as the Ultimate Shield: In financial services, fast growth is dangerous without strict risk control. The primary indicator of a healthy lending model is underwriting quality, monitored closely via the Gross Non-Performing Asset (GNPA) ratio and Credit Cost trends. Maintaining low GNPAs guarantees that rapid loan book growth translates into stable, compounding profitability.
Liability Franchise: Because HFCs are highly leveraged financial intermediaries, their capacity to expand hinges entirely on funding availability. Diversified access to debt markets, bank loans, and institutional refinance channels ensures they can continuously fuel fresh loan disbursements.
Bajaj Housing Finance financial performance
The financial performance metrics reported by Bajaj Housing Finance Limited (NSE:BAJAJHFL) for Q1 FY27 highlight its operational scale and financial strength. Here is a detailed breakdown of what these indicators signify for a major housing finance company:
1. Asset Base and Earning Capacity
- Assets Under Management (AUM) of ₹1,49,624 Crore: This establishes the company as one of the largest upper-layer housing finance companies (HFCs) in India. A large AUM provides strong structural revenue support because it scales up the core interest-earning portfolio.
- Q1 FY27 Profit After Tax (PAT) of ₹715 Crore: This indicates stable quarterly earnings. While a simple math annualization brings it to roughly ₹2,861 crore, actual full-year profits depend heavily on core metrics like Net Interest Income (NII)—the difference between interest earned from borrowers and interest paid to debt markets—and seasonal credit patterns.
2. Capital Strength and Growth Capacity
- Capital Adequacy Ratio (CAR) of 21.59%: This is a vital cushion of financial stability. The Reserve Bank of India (RBI) mandates a minimum CAR of 15% for HFCs. Operating at 21.59% demonstrates that the company has a strong capital base, which reduces insolvency risks and provides significant room to aggressively grow its loan book without needing immediate equity dilution.
- Home Loan Average Ticket Size of ₹48.9 Lakh: This metric confirms the company’s focus on the urban, mass-affluent salaried segment. Sourcing larger ticket-size loans from prime consumers lowers operational expenses per account and supports clean asset quality.
3. Key Financial Valuation Frameworks
Core Metrics to Watch: Analysts track Net Interest Margin (NIM) to evaluate pricing power, Return on Assets (RoA) to verify asset utilization efficiency, and Gross Non-Performing Assets (GNPA) alongside Credit Costs to test the strictness of the company’s underwriting systems during economic shifts.
The Irrelevance of EBITDA: For standard commercial businesses, EBITDA and EV/EBITDA are core metrics used to evaluate enterprise value. However, for a finance company, interest is a raw operating cost rather than a capital structure expense. Therefore, traditional industrial valuation tools like EBITDA are omitted.
Bajaj Housing Finance share price and valuation
Source: Business Standard
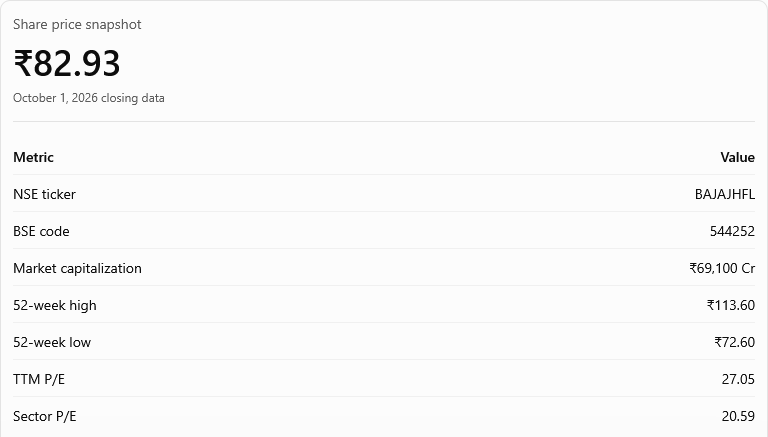
The share price snapshot and market metrics for Bajaj Housing Finance Limited (NSE:BAJAJHFL) as of October 1, 2026, reflect the market’s assessment of its strategic value within the Indian housing finance ecosystem. Here is an elaboration on what these valuation metrics signify:
1. Market Capitalization and Benchmark Premium
- ₹69,100 Crore Market Value: This substantial capitalization firmly establishes the company as a key large-cap player in the specialized lending market.
- The Benchmark Valuation Premium: With a Trailing Twelve Month Price-to-Earnings (TTM P/E) ratio of 27.05 compared to the broader sector P/E benchmark of 20.59, the stock commands a premium. This premium indicates that investors are willing to pay more per rupee of current earnings, betting heavily on the parent group’s customer sourcing ecosystem, its clean asset history, and predictable operational scalability.
2. High-Growth Valuation Risks
- The Cost of High Expectations: Premium valuations leave little room for operational errors. If the company experiences a squeeze in its Net Interest Margins (NIMs), a sharp spike in competitive pricing from larger corporate commercial banks, or localized real estate defaults, the market could compress its P/E multiple, introducing notable downside risk.
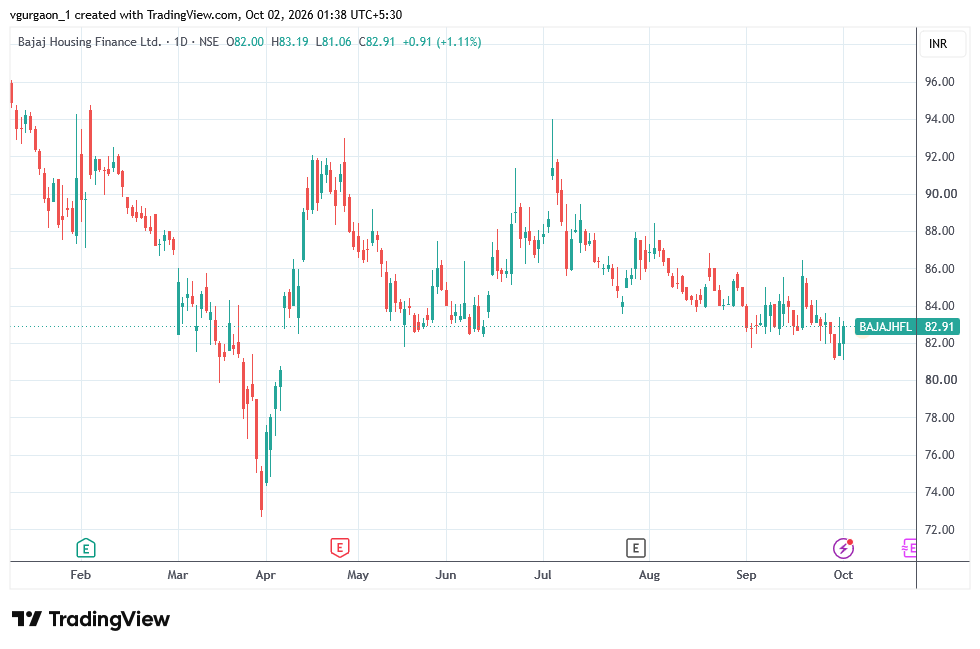
- 52-Week Range Trajectory: Trading at ₹82.93, the stock sits significantly below its 52-week high of ₹113.60 but remains clear of its 52-week low of ₹72.60. This trading range suggests the market is dynamically balancing high initial growth optimism against structural macroeconomic pressures like prevailing systemic interest rates.
3. Advanced Banking Valuation Metrics
Comparable Peer Analysis: When validating the premium, analysts look exclusively at peer pure-play mortgage lenders and upper-layer Housing Finance Companies (HFCs). Comparing its multiples to standard retail banks or diversified micro-lending non-banking financial companies (NBFCs) can warp valuation frameworks due to differences in systemic reserve rules, risk profile dynamics, and capital configurations.
Why Price-to-Book (P/B) Matters More: While the P/E ratio evaluates earnings, financial institutions are optimally analyzed using the Price-to-Book (P/B) ratio. Since a lender’s balance sheet consists primarily of liquid monetary assets, evaluating the premium paid over its net asset book value clarifies how efficiently the underlying equity is being levered to drive profits.
Bajaj Housing Finance EPS projections
These illustrative Earnings Per Share (EPS) scenarios for Bajaj Housing Finance Limited (NSE:BAJAJHFL) highlight how the company’s valuation sensitivity changes under different operating conditions through FY2030. Here is an elaboration on what each case reflects about the lender’s structural economics:
1. Base-Case Scenario: Stable Macro Compounding
- Projections: FY27 EPS at ₹3.50, rising to ₹5.15 by FY30.
- Underlying Model: This scenario assumes that India’s mortgage market expands at a steady, predictable pace. The company continues to open branches in tier-2 and tier-3 locations while successfully tapping the 88+ million customer ecosystem of its parent company, Bajaj Finance Limited (NSE:BAJFINANCE). It assumes net interest margins (NIMs) stay stable, operational expenses grow linearly with revenue, and credit defaults remain low and manageable.
2. Bull-Case Scenario: Accelerated Scale & Margin Expansion
- Projections: FY27 EPS at ₹3.70, accelerating rapidly to ₹6.10 by FY30.
- Underlying Model: The bull case assumes a combination of highly favorable factors:
- Stronger Loan Growth: High-volume volume growth in prime home loans, coupled with faster expansion in high-yield commercial Lease Rental Discounting (LRD) segments.
- Lower Cost of Funds: Systemic interest rates ease or the company receives an upgraded institutional credit standing, lowering its borrowing costs in the money markets.
- High Operating Leverage: Digital credit processing and automated customer sourcing platforms allow the lender to double its loan book size without doubling its employee head count or physical infrastructure costs.
3. Bear-Case Scenario: Margin Squeeze & Systemic Headwinds
- Projections: FY27 EPS limited to ₹3.20, creeping up slowly to ₹3.85 by FY30.
- Underlying Model: This scenario models potential financial stress, such as:
- Intense Competition: Large commercial banks engage in a price war for prime home loans, forcing BAJAJHFL to cut lending rates to protect its market share, which shrinks its net interest margins.
- Rising Funding Costs: High systemic interest rates increase borrowing costs in bond markets, while the company struggle to pass these higher costs along to existing floating-rate retail borrowers.
- Asset Quality Strain: Slower economic growth or a drop in employment levels could cause minor upticks in credit costs and non-performing loans, requiring larger capital provisions that eat directly into net profits.
Summary Scenario Grid
Calculated using Google Finance data. Might be shortened for brevity.
| Financial Year | Bear-Case EPS | Base-Case EPS | Bull-Case EPS |
|---|---|---|---|
| FY2027 | ₹3.20 | ₹3.50 | ₹3.70 |
| FY2028 | ₹3.45 | ₹4.00 | ₹4.40 |
| FY2029 | ₹3.65 | ₹4.55 | ₹5.20 |
| FY2030 | ₹3.85 | ₹5.15 |
Bajaj Housing Finance share price target 2026
The illustrative share price target scenarios for Bajaj Housing Finance Limited (NSE:BAJAJHFL) for the remaining months of 2026 evaluate how shifts in market sentiment and underlying earnings performance influence valuation. Here is an elaboration on what these targets signify:
1. Base-Case Scenario (Market Alignment)
- Target Metric: ₹87.50 (Derived from an EPS of ₹3.50 multiplied by a P/E of 25).
- Significance: This scenario acts as a realistic midpoint. Compared to the October 1 closing price of ₹82.93, it reflects an expected 5.5% upside. It assumes that the company achieves its regular credit-growth milestones, keeps asset defaults to a minimum, and maintains a stable P/E ratio inline with its current structural advantages, avoiding severe sector volatility.
2. Bull-Case Scenario (Premium Growth Trajectory)
- Target Metric: ₹111 (Derived from an EPS of ₹3.70 multiplied by a P/E of 30).
- Significance: The bull case models a situation where investor optimism rises significantly, pushing the stock close to its 52-week high of ₹113.60. For this target to be hit by December 2026, the company would need to report strong, front-loaded asset growth, stable or improving margins despite banking competition, and lower capital borrowing costs that justify commanding a P/E multiple of 30.
3. Bear-Case Scenario (Multiple Compression Risk)
- Target Metric: ₹64 (Derived from an EPS of ₹3.20 multiplied by a P/E of 20).
- Significance: This case serves as a downside risk alert, mapping out a scenario where the stock breaks below its current 52-week low of ₹72.60. A target of ₹64 occurs if a slowing housing market hampers loan growth, while high money-market interest rates compress margins. This combined impact would cause earnings to miss expectations and drive down investor sentiment, compressing the company’s valuation multiple down to the sector average of 20.
Summary Target Matrix
Calculated using Google Finance data. Might be shortened for brevity.
| Scenario | FY2027 EPS | Assumed P/E Multiple | Illustrative Price Target |
|---|---|---|---|
| Bear Case | ₹3.20 | 20x | ₹64.00 |
| Base Case | ₹3.50 | 25x | ₹87.50 |
| Bull Case | ₹3.70 | 30x | ₹111.00 |
Bajaj Housing Finance share price target 2027
The illustrative share price target scenarios for Bajaj Housing Finance Limited (NSE:BAJAJHFL) for calendar year 2027 evaluate how different operating paths interact with valuation multiples over a longer time horizon. Here is a detailed breakdown of what these target frameworks signify for the company’s compounding trajectory:
1. Base-Case Scenario (Sustained Compounding)
- Target Metric: ₹100.00 (Derived from an illustrative FY2028 EPS of ₹4.00 multiplied by a structural P/E multiple of 25).
- Significance: The base case represents a steady compounding trajectory. To achieve this valuation by 2027, the company must successfully maintain its pace of mortgage disbursements without suffering any material erosion in asset quality. This model assumes the lender successfully navigates competition from major commercial banking institutions and continues to leverage the captive customer franchise of its parent company, Bajaj Finance Limited (NSE:BAJFINANCE), keeping customer acquisition costs optimized.
2. Bull-Case Scenario (Premium Growth Realized)
- Target Metric: ₹132.00 (Derived from an illustrative FY2028 EPS of ₹4.40 multiplied by an aggressive P/E multiple of 30).
- Significance: The bull case models an ideal macroeconomic environment. This target requires structural tailwinds, such as a drop in systemic interest rates by the Reserve Bank of India (RBI), which lowers money-market borrowing costs and expands Net Interest Margins (NIMs). Operationally, it requires high volume growth in retail home loans alongside high-yield commercial Lease Rental Discounting (LRD) segments, proving to the market that the business deserves to trade at a premium 30x multiple due to superior return ratios.
3. Bear-Case Scenario (Valuation De-rating Risk)
- Target Metric: ₹65.55 (Derived from an illustrative FY2028 EPS of ₹3.45 multiplied by a compressed P/E multiple of 19).
- Significance: The bear case serves as a warning for multiple compression. If structural pressures arise—such as persistent inflation keeping funding economics stressed or a cyclical slowdown in the broader real estate market—loan growth will decelerate. Under this scenario, a mild uptick in defaults would push up credit costs, dragging down the earnings growth rate. The market would respond by de-rating the stock down to a multiple of 19x, which is just below the broader sector average.
Summary Target Matrix for 2027
Calculated using Google Finance data. Might be shortened for brevity.
| Scenario | FY2028 EPS Assumption | Assumed P/E Multiple | Illustrative Price Target |
|---|---|---|---|
| Bear Case | ₹3.45 | 19x | ₹65.55 |
| Base Case | ₹4.00 | 25x | ₹100.00 |
| Bull Case | ₹4.40 | 30x | ₹132.00 |
Bajaj Housing Finance share price target 2030
The illustrative share price target scenarios for Bajaj Housing Finance Limited (NSE:BAJAJHFL) for calendar year 2030 assess the long-term compounding path of the lender. Over a multi-year horizon, long-term targets carry higher uncertainty because prolonged changes in the Reserve Bank of India (RBI) interest rate cycles, shifting regulatory frameworks for upper-layer Housing Finance Companies (HFCs), and competitive pressures can significantly change the financial outcome.
Here is an elaboration on what each long-term scenario indicates:
1. Base-Case Scenario: Multi-Year Compounding Stability
- Target Metric: ₹128.75 (Derived from an illustrative FY2030 EPS of ₹5.15 multiplied by a steady P/E multiple of 25).
- Significance: This scenario acts as the standard growth benchmark. It assumes that Bajaj Housing Finance successfully scales its Assets Under Management (AUM) by expanding its branch footprint deep into tier-2 and tier-3 urban markets. It also assumes the company keeps its market-leading asset quality intact, ensuring that credit costs do not eat into compounding margins. By keeping a stable 25x multiple, the market acknowledges the company’s structural competitive edge derived from the broader ecosystem of its parent entity, Bajaj Finance Limited (NSE:BAJFINANCE).
2. Bull-Case Scenario: Maximum Scale & High Return Ratios
- Target Metric: ₹183.00 (Derived from an illustrative FY2030 EPS of ₹6.10 multiplied by a premium P/E multiple of 30).
- Significance: The bull case requires perfect execution and favorable macroeconomics. To achieve an EPS of ₹6.10 by 2030, the company would need to see rapid scaling in its high-margin loan portfolios—such as commercial Lease Rental Discounting (LRD)—while leveraging strong operating leverage from automated, digital underwriting platforms to push down its cost-to-income ratio. The premium 30x P/E multiple assumes that the business consistently maintains top-tier Return on Assets (RoA) and Return on Equity (RoE), commandingly defending its premium valuation over industry peers.
3. Bear-Case Scenario: Secular Growth Slowdown and De-rating
- Target Metric: ₹65.45 (Derived from an illustrative FY2030 EPS of ₹3.85 multiplied by a compressed P/E multiple of 17).
- Significance: The bear case shows the compounding risks of structural deceleration. If India’s real estate market faces a long-term slowdown, or if intense price competition from large public and private sector commercial banks forces a long-term squeeze on Net Interest Margins (NIMs), loan growth will drop. In this case, even small increases in non-performing assets would expand provisioning costs, capping the FY30 EPS at ₹3.85. Reflecting this slower earnings momentum, investors would compress the stock’s valuation multiple down to a conservative 17x, causing the stock to trade below its historical 52-week lows.
Summary Valuation Targets Matrix (2030)
Calculated using Google Finance data. Might be shortened for brevity.
| Valuation Scenario | Illustrative FY2030 EPS | Assumed P/E Multiple | Illustrative Price Target |
|---|---|---|---|
| Bear Case | ₹3.85 | 17x | ₹65.45 |
| Base Case | ₹5.15 | 25x | ₹128.75 |
| Bull Case | ₹6.10 | 30x | ₹183.00 |
Bajaj Housing Finance share price target 2026, 2027, 2030: Bull vs Base vs Bear
The provided matrix outlines an illustrative scenario framework comparing Bear vs. Base vs. Bull price targets for Bajaj Housing Finance Limited (NSE:BAJAJHFL) across three distinct milestones (2026, 2027, and 2030).
By varying two primary financial variables—Earnings Per Share (EPS) and the Price-to-Earnings (P/E) Multiple—the framework models how shifts in business execution and market sentiment can fundamentally reshape the stock’s valuation over time.
1. The Base Case: Consistent, Managed Compounding
- Targets: ₹87.50 (2026)
→ ₹100.00 (2027)
→ ₹128.75 (2030)
- Strategic Narrative: This scenario represents a steady-state assumption where the company maintains a stable premium multiple (25x P/E). It reflects a scenario where Bajaj Housing Finance increases its Assets Under Management (AUM) inline with India’s long-term housing credit expansion.
- Operational Triggers: Success here relies on leveraging the massive customer network of its parent company, Bajaj Finance Limited (NSE:BAJFINANCE), to keep retail customer acquisition costs minimal, maintaining top-tier asset quality (low Gross NPAs), and avoiding severe funding cost pressures.
2. The Bull Case: The Premium Multiplier Effect
- Targets: ₹111.00 (2026)
→ ₹132.00 (2027)
→ ₹183.00 (2030)
- Strategic Narrative: The bull case showcases the power of dual expansion, where both the underlying earnings and the market valuation multiple (30x P/E) expand simultaneously.
- Operational Triggers: For the stock to scale toward ₹183 by 2030, the business must achieve high volume growth in its home loan pipeline alongside sharp growth in high-yield segments like commercial Lease Rental Discounting (LRD). This scenario assumes high operating leverage through digital lending tech and a favorable macroeconomic environment, such as rate cuts by the Reserve Bank of India, which lower corporate borrowing costs and expand Net Interest Margins (NIMs).
3. The Bear Case: Multiple Compression and Growth Stagnation
- Targets: ₹64.00 (2026)
→ ₹65.55 (2027)
→ ₹65.45 (2030)
- Strategic Narrative: The bear case acts as a critical risk caution, illustrating how a premium stock can experience valuation “de-rating.” Notice that the target remains virtually flat from 2026 through 2030 (hovering around ₹64 to ₹65), even if minimal earnings growth occurs.
- Operational Triggers: If aggressive price wars from large commercial banking institutions force the company to sacrifice yields, its margins will contract. If tight systemic liquidity keeps funding costs high, or if economic headwinds trigger defaults in commercial real estate or affordable housing portfolios, credit provisions will increase. Consequently, the market would strip away the company’s valuation premium, compressing its P/E multiple down toward a conservative 17x–19x sector average.
Multi-Year Comparative Matrix
Calculated using illustrative model assumptions. Might be shortened for brevity.
| Milestone Year | Bear-Case Target | Base-Case Target | Bull-Case Target | Target Core Variables |
|---|---|---|---|---|
| 2026 | ₹64.00 | ₹87.50 | ₹111.00 | Based on FY27 Scenario Assumptions |
| 2027 | ₹65.55 | ₹100.00 | ₹132.00 | Based on FY28 Scenario Assumptions |
| 2030 | ₹65.45 | ₹128.75 | ₹183.00 | Based on FY30 Scenario Assumptions |
Key factors that could drive Bajaj Housing Finance share price
The market performance and long-term valuation trajectory of Bajaj Housing Finance Limited (NSE:BAJAJHFL) are driven by a mix of micro-operational strengths and macroeconomic forces. Here is a detailed elaboration on how these key factors function as stock price drivers within the Indian mortgage market:
1. Loan-Book Growth (AUM Scaling)
Assets Under Management (AUM) serve as the foundation for the company’s revenue. When the loan book expands—driven by its footprint across 182+ locations—it directly increases core Net Interest Income (NII). Because home loans are long-term compounding assets, sustained AUM growth provides long-term clarity for future revenue streams, making it a critical metric for institutional investors.
2. Funding Costs and Borrowing Mix
As a non-deposit-taking Housing Finance Company (HFC), BAJAJHFL relies heavily on debt markets, commercial banks, and National Housing Bank (NHB) allocations to raise capital.
- A lower cost of funds allows the company to protect its Net Interest Margins (NIMs).
- Efficient capital sourcing ensures that when systemic interest rates rise, the company can avoid compressing its margins or passing excessive rate hikes onto retail borrowers.
3. Asset Quality and Risk Control
In a highly leveraged lending model, clean asset quality is vital for maintaining profitability. The company keeps an exceptionally low Gross NPA ratio (historically around 0.29%), which reduces provisioning requirements. Controlled credit costs mean that a larger portion of operational income flows directly to Net Profit After Tax (PAT), supporting higher earnings stability.
4. Operational Efficiencies (Operating Leverage)
As the loan portfolio scales up, fixed operational expenses—such as automated digital underwriting platforms, centralized risk compliance, and tech infrastructure—are spread across a much larger base of interest-earning assets. This improves the company’s cost-to-income metrics, allowing profit margins to expand faster than revenues.
5. Macro Housing Demand and Real Estate Tailwinds
The underlying velocity of mortgage demand is highly sensitive to external economic factors:
- Affordability and Urbanization: Rising disposable middle-class incomes and the trend toward nuclear household formation act as structural tailwinds.
- Affordability Squeezes: If property prices spike rapidly or interest rates remain high for too long, buyers may delay purchasing, slowing overall retail loan disbursement volumes.
6. Capital Adequacy Ratio (CAR)
A strong Capital Adequacy Ratio (which sat at 21.59% as of June 30, 2026) acts as both a regulatory safety shield and an engine for future growth. Because the Reserve Bank of India (RBI) enforces a strict 15% CAR limit for HFCs, maintaining a comfortable capital buffer ensures BAJAJHFL can aggressively pursue lending expansions without facing sudden equity dilution or capital shortages.
7. Competitive Intensification
The housing finance sector is a competitive battlefield where large public and private sector commercial banks fight aggressively for prime customers. Increased competition can trigger price wars on home loan rates. BAJAJHFL counters this by leveraging the massive 88+ million customer ecosystem of its parent entity, Bajaj Finance Limited (NSE:BAJFINANCE), allowing it to source pre-approved borrowers at significantly lower customer acquisition costs (CAC) than its peers.
8. Institutional Ownership and Sentiment Shifts
As a prominent upper-layer financial stock, BAJAJHFL’s stock liquidity is highly dependent on institutional inflows from Foreign Portfolio Investors (FPIs) and domestic Mutual Funds. Large-scale structural shifts in institutional allocations often impact short-term market sentiment and price discovery, reflecting the street’s collective confidence in the broader Bajaj group franchise.
Risks to the Bajaj Housing Finance share price target
The valuation target and market performance of Bajaj Housing Finance Limited (NSE:BAJAJHFL) face a variety of micro-operational challenges and structural macroeconomic risks. Here is an elaboration on how each identified factor poses a risk to the stock’s target price:
1. Valuation Multiple De-rating Risk
Trading at a TTM P/E of 27.05, the stock commands a premium relative to the broader sector benchmark of 20.59. Premium valuations create a high bar for operational execution. If loan growth decelerates, net interest margins compress, or quarterly profits simply fall short of high street expectations, the market could swiftly strip away this premium. Compressing the P/E multiple down toward the sector benchmark would trigger sharp downside price adjustments even if earnings remain marginally positive.
2. Cyclical Interest-Rate & Squeeze Risk
As a leveraged non-banking mortgage lender, the company’s financial model depends on the timing gap between passing rate changes to its customers versus absorbing rate adjustments from debt markets. If tight systemic liquidity drives up corporate commercial borrowing costs faster than the company can reset rates on its floating retail mortgage book, it will trigger an immediate squeeze on Net Interest Margins (NIMs), directly lowering the company’s net profit margins.
3. Credit Risk & Provisioning Overheads
In mortgage lending, rapid volume scaling introduces long-term credit underwriting hazards. While the lender maintains clean credit health with an industry-leading Gross NPA of 0.29% as of June 30, 2026, cyclical microeconomic stress—such as structural job cuts or a broad real estate slowdown—could strain borrower repayment capacity. An uptick in loan delinquencies requires the company to set aside larger capital allocations for credit provisions, which directly eats into the company’s Net Profit After Tax (PAT).
4. Aggressive Competitive Headwinds
The Indian mortgage space is a high-volume price battlefield dominated by massive public and private sector commercial banking corporations. Banks often leverage cheap retail deposits to offer lower interest rates to prime salaried individuals. To shield its market position, BAJAJHFL may be pressured to engage in margin-diluting rate matching, dampening its yield profile and testing its cross-selling customer acquisition cost advantage.
5. Regulatory Squeezes & Capital Buffers
Classified as an “Upper Layer” institution by the Reserve Bank of India (RBI), the company is subject to strict regulatory scrutiny. Future changes in mandatory risk-weighting parameters for home loans, adjustments to provisioning rules for commercial developer financing, or changes to capital adequacy thresholds can restrict capital deployment velocity. A mandate to hold more capital reserves reduces the efficiency of the company’s return ratios.
6. Operational & Geographic Execution Hurdles
Sustaining rapid portfolio scaling while entering tier-2 and tier-3 markets demands tight operational controls. Entering geographic locations away from the company’s primary corporate strongholds requires local collection networks and localized property underwriting validation models. A failure in risk management during geographic scaling can manifest as an adverse surge in bad loans down the line.
7. Global Macroeconomic Market Risk
Beyond individual corporate performance, the stock’s valuation remains vulnerable to shifts in overall equity market liquidity. Periods of global macro weakness, broad structural outflows from foreign institutional investors (FIIs), or general domestic market liquidations can drag down premium large-cap finance counters like BAJAJHFL due to shifting risk preferences, regardless of the underlying quality of its loan book.
Is Bajaj Housing Finance a long-term growth story?
The structural expansion of Bajaj Housing Finance Limited (NSE:BAJAJHFL) highlights the fundamental characteristics that long-term investors weigh when evaluating a premium financial compounder:
1. The Core Bull Case: Structural Market Room
- Under-Penetrated Credit Ecosystem: India’s mortgage-to-GDP ratio remains considerably lower than that of developed market peers, indicating multi-decade long-term structural headroom. Factors like rapid urbanization and nuclear household formations offer a massive target demographic.
- Scale and Platform Advantages: Operating with an Assets Under Management (AUM) base of nearly ₹1.5 lakh crore gives the company a substantial scale advantage. This large scale helps lower funding costs in debt markets.
- The Sourcing Flywheel: By utilizing the pre-approved database of its parent company, Bajaj Finance Limited (NSE:BAJFINANCE), the company avoids high retail customer acquisition costs (CAC). This unique synergy helps maintain an industry-leading Gross NPA of just 0.29%, showcasing strong credit risk management.
2. The Core Bear Case: Valuation vs. Realized Performance
- The Cost of High Expectations: The main concern for long-term investors is the company’s valuation premium. With a trailing P/E of 27.05 compared to the sector average of 20.59, the stock already incorporates expectations for near-flawless execution.
- The Premium De-rating Trap: If structural net interest margins contract due to aggressive price competition from large retail commercial banks, or if credit costs rise during a local real estate correction, growth can slow down. In such cases, the stock faces multiple compression risks, where the stock price stays flat or drops even if earnings continue to grow.
3. Vital Indicators for Long-Term Monitoring
To evaluate the sustainability of this long-term growth story, investors should track several core performance indicators:
- Quarterly AUM Velocity: Ensures the company continues to expand its retail loan footprint without relaxing its credit standards.
- Net Interest Margins (NIMs): Measures the company’s pricing power against commercial banks.
- Credit Costs & Delinquency Provisions: Tracks the performance of newer loans opened in tier-2 and tier-3 cities.
- Return on Assets (RoA) and Return on Equity (RoE): Verifies if the management team is generating efficient capital returns.
- Capital Adequacy Ratio (CAR): Confirms if the company retains a solid capital buffer (which sat at 21.59% as of June 30, 2026) to fund loan growth without diluting shares.
Frequently asked questions
1. What is Bajaj Housing Finance share price target for 2026?
The illustrative 2026 scenario range is ₹64 to ₹111 per share, with a base-case calculation of ₹87.50. These values use assumed FY2027 EPS and P/E multiples.
2. What is Bajaj Housing Finance share price target for 2027?
The illustrative 2027 range is ₹65.55 to ₹132, with a base-case value of ₹100, based on assumed FY2028 earnings.
3. What is Bajaj Housing Finance share price target for 2030?
The illustrative 2030 range is ₹65.45 to ₹183. The base case of ₹128.75 assumes FY2030 EPS of ₹5.15 and a P/E multiple of 25.
4. What factors could affect Bajaj Housing Finance share price?
Loan-book growth, housing demand, funding costs, net interest margins, asset quality, capital adequacy, competition, and market valuations are among the main factors.
5. What valuation method is used for the target?
The analysis uses an illustrative forward earnings valuation method:
Estimated EPS × Assumed P/E = Calculated share price
Different EPS and P/E assumptions are used for the bear, base, and bull scenarios.
6. What are the major risks to the target?
The main risks include valuation compression, slower loan growth, rising credit costs, pressure on lending margins, regulatory changes, and stronger competition.
Source quality report

Primary company resources:
- Bajaj Housing Finance investor presentations
- Bajaj Housing Finance quarterly press releases
- Bajaj Housing Finance stock exchange disclosures
Disclaimer: These share price targets are scenario-based estimates for educational and informational purposes only. They are not guaranteed price predictions or investment advice. Actual prices may differ materially depending on earnings, valuation, market conditions and company-specific developments.
Illustrative Bajaj Housing Finance price scenarios
Scenario-based valuation estimates in ₹ per share. Not a forecast of actual market prices.
| year | bear | base | bull |
|---|---|---|---|
| 2026 | 64 | 87.5 | 111 |
| 2027 | 65.55 | 100 | 132 |
| 2030 | 65.45 | 128.75 | 183 |
Bajaj Housing Finance Share Price History (Oct 2026)
| Date | Price | Open | High | Low | Vol. | Change % |
|---|
| 5/10/2026 | 82.79 | 83.99 | 84.05 | 81.61 | 3.69M | -0.14% |
| 1/10/2026 | 82.91 | 82 | 83.19 | 81.01 | 5.60M | 1.11% |
Bajaj Housing Finance Share Price History (Sept 2026)
| Date | Price | Open | High | Low | Vol. | Change % |
|---|---|---|---|---|---|---|
| 5/10/2026 | 82.79 | 83.99 | 84.05 | 81.61 | 3.69M | -0.14% |
| 1/10/2026 | 82.91 | 82 | 83.19 | 81.01 | 5.60M | 1.11% |
| 30-09-2026 | 82 | 81.33 | 82.4 | 81.33 | 4.28M | 0.91% |
| 29-09-2026 | 81.26 | 82.5 | 82.5 | 81.06 | 2.83M | -1.53% |
| 28-09-2026 | 82.52 | 83.14 | 83.14 | 82 | 2.88M | -0.75% |
| 25-09-2026 | 83.14 | 83.03 | 83.6 | 81.96 | 3.12M | 0.22% |
| 24-09-2026 | 82.96 | 83.28 | 83.39 | 82.08 | 4.58M | -0.67% |
| 23-09-2026 | 83.52 | 83.12 | 84.28 | 83.12 | 2.18M | 0.48% |
| 22-09-2026 | 83.12 | 84.03 | 84.31 | 82.98 | 1.75M | -1.02% |
| 21-09-2026 | 83.98 | 85.2 | 84.47 | 83.84 | 2.16M | -1.87% |
| 18-09-2026 | 85.58 | 82.83 | 86.45 | 82.71 | 5.17M | 3.48% |
| 17-09-2026 | 82.7 | 82.9 | 83.51 | 82.63 | 1.56M | -0.31% |
| 16-09-2026 | 82.96 | 83.78 | 83.78 | 82.4 | 2.50M | -1.24% |
| 15-09-2026 | 84 | 84.26 | 84.53 | 83.08 | 3.99M | -0.13% |
| 11/9/2026 | 84.11 | 83.6 | 85.51 | 82.9 | 5.14M | -0.13% |
| 10/9/2026 | 84.22 | 82.82 | 84.64 | 82.4 | 3.73M | 1.57% |
| 9/9/2026 | 82.92 | 84.1 | 84.1 | 82.79 | 1.81M | -1.30% |
| 8/9/2026 | 84.01 | 83.51 | 84.2 | 82.58 | 3.51M | -0.04% |
| 7/9/2026 | 84.04 | 82.91 | 84.98 | 82.5 | 3.88M | 1.16% |
| 4/9/2026 | 83.08 | 83 | 83.55 | 82.93 | 1.82M | 0.16% |
| 3/9/2026 | 82.95 | 82.96 | 83.47 | 82.5 | 2.48M | 0.21% |
| 2/9/2026 | 82.78 | 82.82 | 83.06 | 81.71 | 2.28M | -0.08% |
| 1/9/2026 | 82.85 | 84 | 84.1 | 82.6 | 3.15M | -1.39% |
Bajaj Housing Finance Share Price History (Aug 2026)
| Date | Price | Open | High | Low | Vol. | Change % |
|---|
| 31-08-2026 | 84.02 | 85 | 85 | 83.92 | 2.15M | -1.15% |
| 28-08-2026 | 85 | 85.71 | 85.79 | 84.76 | 1.69M | -0.34% |
| 27-08-2026 | 85.29 | 84.05 | 85.4 | 83.9 | 4.36M | 1.45% |
| 26-08-2026 | 84.07 | 84.07 | 84.5 | 84.02 | 1.53M | 0.06% |
| 25-08-2026 | 84.02 | 84 | 84.33 | 83.78 | 1.82M | -0.04% |
| 24-08-2026 | 84.05 | 84.85 | 85.11 | 83.96 | 3.01M | -0.94% |
| 21-08-2026 | 84.85 | 85.99 | 85.99 | 84.8 | 1.84M | -0.86% |
| 20-08-2026 | 85.59 | 86 | 86.82 | 85.32 | 5.04M | 0.68% |
| 19-08-2026 | 85.01 | 84 | 85.16 | 83.85 | 2.90M | 0.77% |
| 18-08-2026 | 84.36 | 84.58 | 84.9 | 84.07 | 1.89M | 0.43% |
| 17-08-2026 | 84 | 84.32 | 84.6 | 83.67 | 2.26M | -0.39% |
| 14-08-2026 | 84.33 | 84.5 | 84.57 | 84.05 | 1.35M | -0.05% |
| 13-08-2026 | 84.37 | 85 | 85.01 | 84.26 | 1.83M | -0.46% |
| 12/8/2026 | 84.76 | 85.6 | 85.62 | 84.62 | 1.81M | -0.49% |
| 11/8/2026 | 85.18 | 85.21 | 86 | 84.9 | 2.19M | 0.14% |
| 10/8/2026 | 85.06 | 85.59 | 85.75 | 84.96 | 3.15M | -0.85% |
| 7/8/2026 | 85.79 | 86.55 | 86.55 | 85.61 | 2.17M | -0.72% |
| 6/8/2026 | 86.41 | 86.98 | 87.1 | 86.11 | 2.17M | -0.66% |
| 5/8/2026 | 86.98 | 87.5 | 87.52 | 86.6 | 2.12M | -0.15% |
| 4/8/2026 | 87.11 | 86.83 | 88.4 | 86.52 | 4.96M | 0.30% |
| 3/8/2026 | 86.85 | 86.85 | 87.29 | 86.31 | 3.21M | 0.96% |
Bajaj Housing Finance Share Price History (July 2026)
| 31-07-2026 | 86.02 | 86.96 | 87.75 | 85.8 | 6.27M | -0.58% |
| 30-07-2026 | 86.52 | 87.53 | 87.53 | 85.35 | 7.47M | -1.27% |
| 29-07-2026 | 87.63 | 86 | 87.95 | 85.42 | 5.06M | 2.30% |
| 28-07-2026 | 85.66 | 85.5 | 86 | 85.08 | 2.07M | 0.19% |
| 27-07-2026 | 85.5 | 84.98 | 85.88 | 84.98 | 2.13M | 1.56% |
| 24-07-2026 | 84.19 | 84 | 84.52 | 83.55 | 3.39M | -0.73% |
| 23-07-2026 | 84.81 | 85.06 | 86.08 | 84.43 | 2.15M | -0.76% |
| 22-07-2026 | 85.46 | 86 | 86.23 | 85.06 | 1.84M | -0.82% |
| 21-07-2026 | 86.17 | 86 | 86.65 | 85.82 | 1.80M | 0.16% |
| 20-07-2026 | 86.03 | 86 | 86.25 | 85.64 | 1.97M | -0.36% |
| 17-07-2026 | 86.34 | 86.38 | 86.6 | 86 | 2.09M | -0.03% |
| 16-07-2026 | 86.37 | 87.49 | 87.89 | 86.29 | 2.79M | -1.25% |
| 15-07-2026 | 87.46 | 87.34 | 87.88 | 87.2 | 2.02M | 0.16% |
| 14-07-2026 | 87.32 | 88.02 | 88.09 | 86.95 | 2.50M | -1.41% |
| 13-07-2026 | 88.57 | 87.39 | 89.44 | 86.8 | 4.46M | 0.57% |
| 10/7/2026 | 88.07 | 88 | 88.99 | 87.9 | 2.55M | 0.55% |
| 9/7/2026 | 87.59 | 85.95 | 88.1 | 85.85 | 3.88M | 1.86% |
| 8/7/2026 | 85.99 | 88 | 89.45 | 85.56 | 4.99M | -2.87% |
| 7/7/2026 | 88.53 | 90.21 | 90.79 | 88.28 | 3.86M | -1.74% |
| 6/7/2026 | 90.1 | 91.7 | 91.85 | 89.38 | 5.67M | -1.37% |
| 3/7/2026 | 91.35 | 91 | 94 | 90.75 | 37.73M | 3.05% |
| 2/7/2026 | 88.65 | 88.28 | 89.08 | 87.91 | 3.12M | -0.08% |
| 1/7/2026 | 87.84 | 87.75 | 88.37 | 87.32 | 2.48M | 0.77% |