

Table of Contents
The outlook for Larsen & Toubro (NSE: LT, BSE: 500510) depends on its ability to convert a large order book into profitable revenue, sustain earnings growth and manage execution risks across domestic and international projects.
L&T’s FY2026 annual report highlights reported group revenue of ₹2.86 lakh crore, recurring profit after tax of ₹17,238 crore and a record order book of ₹7.40 lakh crore. Its Q1 FY2027 results subsequently showed 7% year-on-year group revenue growth and 14% growth in group profit after tax, although operating margins came under pressure.
MCX Gold Price Today | Gold Rate Today
HAL Share Price Target 2026, 2027, 2030
Tata Motors Share Price Target 2026, 2027, 2030
Current L&T share price and latest financial position
Latest reported results
| Metric | FY2026 | Q1 FY2027 |
|---|---|---|
| Group revenue | ₹2.86 lakh crore | ₹67,900 crore |
| Revenue growth YoY | 12% | 7% |
| Group recurring PAT | ₹17,238 crore | — |
| Group PAT | — | ₹4,100 crore |
| PAT growth YoY | 18% recurring PAT | 14% |
| Group order book | ₹7.40 lakh crore at year-end | ₹7.79 lakh crore |
| Order inflow | ₹4.36 lakh crore | ₹1.08 lakh crore |
Sources: FY2026 annual report highlights and Q1 FY2027 earnings-call transcript. FY2026 recurring PAT and Q1 FY2027 reported PAT are different period-specific measures; dashes indicate figures not included in this summary.
The company reported a 28% year-on-year increase in its FY2026 closing order book. Q1 FY2027 revenue growth was slower than the full-year rate, while group EBITDA margin excluding other income declined to 9.0% from 9.9% a year earlier. That combination suggests good revenue visibility, but continued execution and margin recovery are important for future earnings.
Data limitation: The latest verified quarterly source used here is Q1 FY2027. I have not independently verified every detailed FY2026/FY2027 financial-statement line or a complete analyst-consensus EPS series. Consequently, the EPS projections below are transparent scenario assumptions, not consensus estimates or company guidance.
L&T business and growth outlook
1. Massive Backlog Execution over Bookings
As of the conclusion of FY2026, L&T holds a monumental order book of ₹7.40 lakh crore ($7.4 trillion INR). While securing new order announcements keeps market sentiment high, the primary metric for earnings per share (EPS) acceleration is now execution efficiency. Turning this massive backlog into recognized revenue and milestone-based cash collections protects operating margins, which have recently experienced near-term pressure from geopolitical complexities.
2. Geopolitical Diversification via GCC Markets
With 52% of its FY2026 closing order book deriving from international markets, L&T has heavily leveraged the Gulf Cooperation Council (GCC) capex boom. Hydrocarbon, massive solar grids, and mega-infrastructure projects in the Middle East act as a strategic hedge against domestic government spending cycles in India.
3. Structural Pivot to Green and Digital High-Tech
Beyond traditional Civil and Industrial EPC, L&T is transitioning into a high-margin technology provider:
- Green Energy Transition: Focus on green hydrogen, high-voltage transmission networks, and nuclear-related engineering.
- Digital Infrastructure: Investing significantly in data centers, cloud platforms, and semiconductor design.
4. Aggressive Balance Sheet Clean-up
Historically, conglomerates face a penalty for high leverage in non-core units. L&T’s reduction of its net debt-to-equity ratio from 0.60 to 0.35 in FY2026 represents an extraordinary capital allocation feat. By ring-fencing the remaining debt strictly within its financial services arm, L&T Finance, the parent EPC business enjoys a strong, cash-rich balance sheet capable of bidding on ultra-large-scale global projects without straining returns on equity (ROE).
Current Market Position (October 2026)
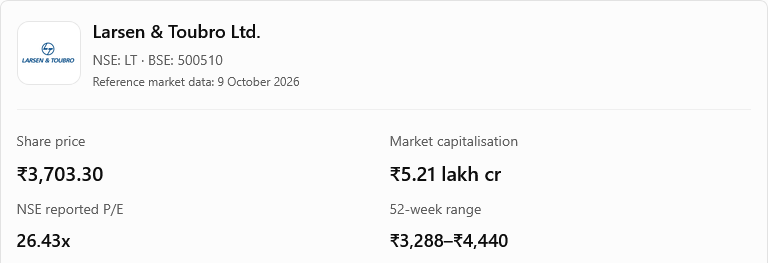
L&T trades at approximately ₹3,696, operating with a P/E multiple of around 30.6x and a market capitalization hovering near ₹5.09 trillion. The 30-analyst consensus target sits near ₹3,905, signaling that institutions see steady double-digit earnings growth from this leaner, high-execution infrastructure giant.
What could limit growth?
The operational bottlenecks that could limit growth for a diversified engineering and infrastructure conglomerate like Larsen & Toubro Limited (INDEXNSE:NIFTY_50 / NSE:LT) include the following:
1. Working Capital Stretches and Cash Conversions
In the Engineering, Procurement, and Construction (EPC) sector, revenue growth does not automatically equal liquidity. If cash is trapped in long milestone billing cycles, retention money held by clients, or protracted disputes with government agencies, working capital expands. This forces the company to rely on short-term debt, driving up finance costs and directly lowering the consolidated Return on Equity (ROE).
2. Margin Volatility in Multi-Year Capital Contracts
Because infrastructure developments span several years, profitability depends on accurately pricing input costs. Unanticipated inflation in global commodity cycles—such as steel, cement, copper, and energy—can sharply erode margins if existing backlogs are bound to fixed-price or inadequately hedged contracts.
3. Concentration and Geopolitical Risks in Foreign Markets
With international orders making up more than half of the multi-trillion backlog, a major portion of future revenue is concentrated in the Gulf Cooperation Council (GCC) area. This structural exposure ties growth closely to Middle Eastern fiscal health. Any sharp correction in crude oil prices, sudden regional geopolitical instability, or aggressive state localization mandates can prompt project delays or unexpected cancellations.
4. Gestation Timelines of New High-Tech Ventures
Pivoting into next-generation ecosystems like green hydrogen, semiconductor design, and cloud data centers requires significant upfront capital expenditure. These sectors carry long gestation periods and highly fluid technology curves. If these capital-intensive bets face delayed timelines or slow adoption rates, they risk acting as a near-term drag on consolidated earnings before generating meaningful inflows.
L&T Share Price Target 2026
| Scenario | Target | Main assumption |
|---|---|---|
| Bear case | ₹2,860 | Earnings disappoint and the P/E falls to 22x |
| Base case | ₹3,770 | EPS reaches ₹145 and the P/E stays near 26x |
| Bull case | ₹4,500 | Earnings exceed expectations and the P/E rises to 30x |
This breakdown elaborates on the late 2026 valuation framework and price target projections for Larsen & Toubro Limited (NSE:LT / INDEXNSE:NIFTY_50):
1. The Core Valuation Tension: Earnings vs. Multiples
At the reference price of ₹3,703.30, L&T’s price-to-earnings (P/E) multiple stands at 26.43x. Because a single multiple is backward-looking, the primary catalyst for the stock over the final months of 2026 is its ability to bounce back from margin compressions reported in Q1 FY2027. If L&T successfully optimizes input costs, it can expand margins and sustain its valuation.
2. Deconstructing the Three 2026 Scenarios
The outlook categorizes late-2026 expectations into three distinct financial paths:
- Bear Case (₹2,860): This scenario assumes structural hurdles—such as prolonged geopolitical friction in the GCC, localized execution delays, or sustained raw material inflation. In this case, earnings disappoint, triggering a valuation de-rating where the market compresses its risk premium and lowers the P/E multiple to 22x.
- Base Case (₹3,770): Assuming execution remains steady and in-line with baseline expectations, trailing Earnings Per Share (EPS) is modeled to reach ₹145. With the P/E multiple holding flat around 26x, the stock sees a modest 1.8% upside from the reference price.
- Bull Case (₹4,500): This scenario hinges on an accelerated monetization of its massive ₹7.40 lakh crore order book, combined with early margin contributions from high-margin digital infrastructure and green energy portfolios. Stronger-than-expected earnings delivery could cause institutional investors to expand multiples, re-rating the stock to 30x P/E.
3. Key Takeaway for Portfolio Allocation
The tight gap between the current price and the base case target suggests that near-term domestic infrastructure expansions are largely priced into the stock. For L&T to unlock the bull-case territory, it requires macro-driven execution outperformance or an aggressive expansion of profit margins.
L&T Share Price Target 2027
| Scenario | Target | Main assumption |
|---|---|---|
| Bear case | ₹3,050 | EPS of ₹145 and P/E of 21x |
| Base case | ₹4,050 | EPS of ₹162 and P/E of 25x |
| Bull case | ₹5,075 | EPS of ₹175 and P/E of 29x |
1. Shifts in Core Valuation Drivers
Moving into 2027, the market’s assessment of L&T transitions from baseline order accumulation to forward FY2028 earnings visibility. While the multi-trillion backlog provides top-line predictability, valuation multiples will depend heavily on quality of execution: margin stability, operating cash flow conversion, and tight control over working-capital cycles.
2. Breakdown of the 2027 Valuation Scenarios
The model breaks down the potential year-end outcomes based on distinct combinations of Earnings Per Share (EPS) and Price-to-Earnings (P/E) multiples:
- Bear Case (₹3,050): This scenario assumes sluggish execution dynamics or extended working capital stress. If EPS stalls at ₹145 and institutional investors lower the stock’s premium—de-rating the P/E multiple to 21x—the share price would face significant downside from current levels.
- Base Case (₹4,050): This baseline assumes steady project completions and stable operating margins. Under these conditions, forward EPS is projected to expand to ₹162. Combined with a supportive P/E multiple of 25x, this path delivers approximately 9.4% appreciation from the reference price.
- Bull Case (₹5,075): This optimistic path requires high-efficiency execution across both domestic infrastructure and high-margin GCC contracts, alongside rapid commercialization of green hydrogen and semiconductor ventures. If EPS rises to ₹175 and strong market sentiment drives a valuation re-rating up to 29x P/E, the stock would unlock maximum growth potential.
3. Investment Implications
The 2027 base case indicates a healthier return profile compared to late-2026 targets. This reflects expectations that initial margin pressures will subside, allowing core operational performance to catch up with the company’s substantial order backlog.
L&T Share Price Target 2030
| Scenario | Target | Main assumption |
|---|---|---|
| Bear case | ₹3,700 | EPS of ₹185 and P/E of 20x |
| Base case | ₹5,625 | EPS of ₹225 and P/E of 25x |
| Bull case | ₹7,400 | EPS of ₹255 and P/E of 29x |
This long-term framework outlines the structural assumptions and potential financial pathways for Larsen & Toubro Limited (NSE:LT / INDEXNSE:NIFTY_50) looking toward the end of the decade:
1. Shift to Structural & Strategy-Driven Valuation
Projecting out to 2030 requires moving past near-term quarterly execution to evaluate the company’s long-term corporate framework. A key driver here is the Lakshya 2031 strategy detailed in its FY2026 reporting. This roadmap shifts the corporate focus away from low-margin volume toward value-added metrics: premium digital adoption, scaled defense manufacturing, advanced power grids, and tech-driven services.
2. The Frontier Tech Risk Factor
The primary variable in L&T’s valuation multiple at the end of the decade is the performance of its newer business divisions. Capital-intensive entries into green hydrogen, domestic semiconductor design, and cloud data centers offer high potential margins, but their eventual contribution to bottom-line group earnings remains unproven. A prolonged period of heavy capital expenditure without matching cash flows would challenge the premium valuation multiple long-term investors expect.
3. Deconstructing the 2030 Scenarios
The model outlines three distinct paths for the stock by the year 2030:
- Bear Case (₹3,700): This outcome assumes that headwinds—such as intense competitive bidding, rising project costs, cyclical cutbacks in government infrastructure budgets, or unfavorable geopolitical realignments—affect performance. Under these conditions, while EPS still rises to ₹185, market multiple compression down to 20x P/E keeps the share price nearly flat compared to 2026 levels.
- Base Case (₹5,625): Assuming a stable macroeconomic environment and smooth execution of the Lakshya 2031 goals, EPS is projected to climb to ₹225. Supported by a stable P/E multiple of 25x, this delivers a ~52% absolute price appreciation from the current reference price.
- Bull Case (₹7,400): This scenario requires high-efficiency execution across core sectors alongside strong commercial success in its green and digital ventures. If EPS scales to ₹255 and strong institutional demand pushes the P/E multiple to a premium 29x, the stock would roughly double from its current reference levels.
4. Strategic Investment Takeaway
The wide spread between the 2030 targets highlights the effect of compounded growth and changing multiples over time. A long-term position in L&T acts as a broader bet on India’s industrial transformation and global clean energy infrastructure. The base and bull cases depend on the company’s ability to successfully transition from a traditional civil engineer into a high-technology industrial conglomerate.
L&T Share Price Target 2026, 2027, 2030: Bull vs Base vs Bear
The following table consolidates the scenario estimates. Upside/downside is measured against the ₹3,703.30 reference price from 9 October 2026.
| Target year | Bear case | Base case | Bull case |
|---|---|---|---|
| 2026 | ₹2,860 (-22.8%) | ₹3,770 (+1.8%) | ₹4,500 (+21.5%) |
| 2027 | ₹3,050 (-17.6%) | ₹4,050 (+9.4%) | ₹5,075 (+37.0%) |
| 2030 | ₹3,700 (-0.1%) | ₹5,625 (+51.9%) | ₹7,400 (+99.8%) |
All targets and implied returns are calculated scenario estimates, not official guidance. Returns are price-only and exclude dividends. The percentages are rounded.
The 2030 bear-case target is close to the reference price because the assumed increase in earnings is offset by a lower P/E multiple. This is an important valuation distinction: a company can grow earnings without delivering equally strong share-price returns if its valuation contracts.
Earnings and EPS projections for FY2027–FY2030
The following figures are my own illustrative assumptions for valuation modelling, not reported EPS, management guidance or published analyst consensus. They are rounded to avoid implying greater precision than the available evidence supports.
| Financial year | Bear EPS | Base EPS | Bull EPS |
|---|---|---|---|
| FY2027 | ₹130 | ₹145 | ₹150 |
| FY2028 | ₹145 | ₹162 | ₹175 |
| FY2029 | ₹163 | ₹192 | ₹215 |
| FY2030 | ₹185 | ₹225 | ₹255 |
The base-case path assumes earnings growth supported by order execution, a diversified business mix and moderate operating improvement. The bear case assumes slower growth and more limited margin recovery. The bull case assumes better execution, stronger profitability and a greater contribution from growth businesses.
The FY2030 share-price target uses an FY2031 illustrative EPS of approximately ₹225 in the base case, extending the earnings trajectory one year beyond FY2030. This makes the 2030 target a forward-looking valuation rather than a simple multiplication of the FY2030 EPS by a P/E ratio.
These EPS figures should be replaced with verified reported diluted EPS and reliable consensus forecasts where available before presenting the estimates as a fully researched institutional valuation.
How We Calculated the L&T Share Price Target
The primary valuation method is forward earnings multiplied by an assumed P/E ratio:
\[ \text{Target Price}=\text{Estimated EPS}\times\text{Assumed P/E} \]
The P/E multiples used below are modelling assumptions, not a claim about L&T’s exact historical average or an official industry valuation benchmark.
Base-case target calculations
| Target horizon | Illustrative forward EPS | Assumed P/E | Calculated target |
|---|---|---|---|
| End-2026 | ₹145 | 26x | ₹3,770 |
| End-2027 | ₹162 | 25x | ₹4,050 |
| End-2030 | ₹225 | 25x | ₹5,625 |
Calculations use rounded EPS and P/E assumptions, so the resulting prices are approximate.
Why use these P/E multiples?
- 2026 — 26x: Close to the NSE-reported P/E of 26.43x on the reference date. This assumes the market broadly maintains its existing valuation.
- 2027 — 25x: Allows for a modest valuation reduction as the forecast period extends and execution uncertainty remains.
- 2030 — 25x: Assumes L&T retains a premium valuation supported by its scale, diversified operations and long-term project opportunities, without assuming a further re-rating.
These multiples are not derived from a verified historical valuation distribution or a fully checked peer-company comparison. The available data is insufficient to make a precise claim that 25x is cheap, expensive or the correct long-term multiple.
Other valuation methods to consider
A complete institutional valuation should supplement P/E analysis with:
- EV/EBITDA: Useful for comparing operating profitability after accounting for enterprise value, although L&T’s diversified businesses complicate direct comparisons.
- Sum-of-the-parts valuation: Could help assess its engineering, technology, financial-services and other businesses separately.
- Discounted cash flow: Requires defensible assumptions for free cash flow, capital expenditure, working capital and the discount rate.
- Peer comparison: Should use consistently dated figures for companies such as Engineers India and KNR Constructions, while accounting for differences in business mix and scale.
I have not assigned numerical values to these additional methods because a sufficiently verified, comparable dataset was not established for this analysis. The targets above therefore remain a simplified earnings-based valuation.
Financial performance: what investors should monitor
The reported FY2026 and Q1 FY2027 figures show growth in revenue and profit, but they do not by themselves establish the future trajectory of every financial metric.
| Financial metric | Research interpretation |
|---|---|
| Revenue | Group revenue rose 12% in FY2026 and 7% year-on-year in Q1 FY2027. |
| EBITDA and margin | The group EBITDA margin excluding other income declined to 9.0% in Q1 FY2027 from 9.9% a year earlier. |
| Profit after tax | Recurring group PAT grew 18% in FY2026; Q1 FY2027 group PAT increased 14% year-on-year. |
| EPS | Requires verification against the relevant consolidated diluted EPS and share count before making a definitive growth comparison. |
| Operating cash flow | The Q1 FY2027 earnings-call transcript reports ₹4,300 crore of operating cash flow excluding financial services. |
| Free cash flow | Not independently established here on a consistent consolidated basis. |
| ROE and ROCE | Should be checked against the latest full-year statements and business-level capital employed. |
| Debt/equity | The FY2026 group net debt-to-equity ratio was reported at 0.35, compared with 0.60 in FY2025. This is not the same as a standalone debt/equity ratio. |
| Interest coverage | Requires a consistent calculation using verified interest expense and operating earnings. |
Sources: L&T FY2026 annual report highlights and Q1 FY2027 earnings-call transcript.
The most important distinction is between accounting profit and cash generation. Large EPC projects can increase reported revenue and profits while also absorbing working capital. Consistent collections and disciplined project execution would strengthen the earnings outlook.
Key factors that could drive L&T’s share price
This structured analysis provides a detailed look at the core drivers that could influence the valuation and market performance of Larsen & Toubro Limited (NSE:LT / INDEXNSE:NIFTY_50) through 2026 and beyond:
1. Revenue Growth and Order Execution Dynamics
For a mega-cap EPC firm, a expanding backlog acts as an incomplete metric on its own. While L&T’s massive multi-trillion order book provides multi-year revenue visibility, the stock’s performance is driven by the cash conversion cycle. Timely completion, milestone-based billing, and rapid cash collection protect the balance sheet from liquidity strain. Efficient project execution ensures the company does not have to rely on expensive short-term working capital loans, which directly helps protect consolidated earnings per share (EPS).
2. Capitalizing on Power, Energy, and Infrastructure Megatrends
L&T serves as a key proxy for both domestic and regional industrial capital expenditure. Growth is supported by structural demand across several areas:
- Grid Modernization: High-voltage transmission lines and smart grid networks.
- Energy Transition: Large-scale solar engineering, procurement, and construction (EPC), conventional thermal upgrades, and nuclear engineering components.
- Urban Transport Infrastructure: Heavy civil contracts for high-speed rail, metro networks, and major highway systems.
3. Frontier Technology Triggers and Long-Term Valuation Multiples
To expand its long-term valuation multiples, L&T is building capabilities in high-margin technology segments. These initiatives include AI-ready data center construction, cloud infrastructure services, and specialized semiconductor design. However, institutional investors continue to evaluate these initiatives carefully; their capacity to deliver meaningful cash flows and high returns on capital remains key to achieving a lasting valuation re-rating.
4. Margin Stability and Cash Flow Optimization
Top-line expansion yields limited value if input costs erode the bottom line. Improving L&T’s profit margins depends on keeping tight control over raw material costs, using protective inflation-escalation clauses in contracts, and focusing on higher-margin international and industrial projects. Strong operational execution combined with strict working capital management helps ensure steady free cash flow, allowing the company to sustain its dividend payouts even during broader economic slowdowns.
5. Disciplined Capital Allocation and Portfolio Optimization
L&T’s long-term corporate strategy relies heavily on refining its asset portfolio. This includes divesting non-core or low-return assets, entering targeted joint ventures, and funding next-generation initiatives through generated cash rather than new debt. As seen in its recent financial updates, lowering the group’s net debt-to-equity ratio helps shield the parent company’s balance sheet, ensuring it remains resilient against global macroeconomic shifts.
Risks to the L&T share price target
This structured overview details the primary operational and structural risks that could affect the investment profile and valuation of Larsen & Toubro Limited (NSE:LT / INDEXNSE:NIFTY_50):
1. Valuation and Multiple Compression
A high backward-looking P/E ratio means the stock’s price relies on hitting aggressive forward growth targets. Even if L&T delivers solid bottom-line earnings growth, its share price can stall or fall if institutional investors de-rate the stock’s valuation multiple. This compression often happens when market sentiment cools or when investors lower the premium they are willing to pay for industrial conglomerates.
2. Operational Execution and Margin Pressure
In ultra-large-scale engineering, procurement, and construction (EPC) projects, small delays can quickly erode profits. Key threats to core margins include:
- Input Cost Volatility: Unexpected inflation in raw materials (steel, cement, copper), rising subcontractor rates, or sudden domestic labor shortages.
- Fixed-Price Backlogs: Contracts that lack strong inflation escalation clauses force L&T to absorb cost overruns directly, turning revenue-rich projects into margin drags.
- Execution Friction: Local bottlenecks, such as slow land acquisitions, delayed environmental clearances, or sudden regulatory policy shifts.
3. Geopolitical and International Concentration
With international projects making up over half of its multi-trillion backlog, L&T has significant exposure to the Gulf Cooperation Council (GCC) region. This structural concentration introduces major external variables:
- Fiscal Fluctuations: Regional infrastructure spending remains tied to global crude oil prices and Middle Eastern sovereign wealth fund priorities.
- Logistical Disruptions: Regional conflicts or supply-chain bottlenecks can block transport routes, delay equipment arrivals, and drive up freight insurance costs.
- Localization Mandates: Aggressive regional policies pushing for local hiring or domestic sourcing can squeeze international profit margins.
4. Working Capital Stress and Cash Conversion
The financial health of an EPC company depends less on order announcements and more on the speed of its cash inflows. If clients delay milestone payments, or if substantial retention money is locked up in extended disputes, L&T’s working capital cycle lengthens. This forces the parent company to use short-term debt to bridge the gap, driving up finance costs and diluting overall Return on Equity (ROE).
5. Intense Bidding Competition
When major infrastructure contracts open up, aggressive bidding from both domestic players and international engineering firms can trigger a “race to the bottom.” Securing large orders through low-margin bids can artificially inflate the headline backlog while severely limiting the company’s ultimate profitability.
6. Subsidiary Debt and Financial Services Exposure
L&T’s consolidated debt profile includes its credit subsidiary, L&T Finance. While the parent company has successfully lowered its core net debt-to-equity ratio, any systemic liquidity stress, rising non-performing assets (NPAs), or credit tightening within the financial services sector could impact the group’s consolidated credit rating and overall balance sheet health.
7. Strategic Forecast Risks
Looking toward longer-term horizons like 2030, predictive modeling becomes highly sensitive to shifting assumptions. Unproven next-generation businesses—such as green hydrogen ecosystems, data hubs, and domestic semiconductor ventures—require massive upfront capital. If these long-dated tech investments run into execution delays or slow adoption curves, they could fail to generate the premium cash flows required to justify a bull-case valuation re-rating.
Is L&T a long-term growth story?
This strategic synthesis examines whether Larsen & Toubro Limited (NSE:LT / INDEXNSE:NIFTY_50) represents a sustainable long-term compounding growth story based on its performance in late 2026:
1. The Core Bull Case: Diversification and Backlog Scale
L&T holds a unique position as a key driver of infrastructure growth in India and the GCC region. Its structural advantages include:
- Backlog Visibility: A substantial ₹7.40 lakh crore order book provides clear multi-year revenue visibility.
- Balance Sheet Strength: Improving the group’s net debt-to-equity ratio from 0.60 to 0.35 in FY2026 helps insulate the parent company’s EPC operations from liquidity risks.
- Sector Breadth: Operations span across traditional infrastructure, defense manufacturing, high-tech engineering services, and next-generation green energy transition projects.
2. The Near-Term Reality Check: Execution Over Backlog Size
Recent performance highlights why a large backlog alone cannot justify a premium valuation multiple. The slower revenue growth and lower consolidated EBITDA margins recorded in Q1 FY2027 underscore that execution capability drives actual value. When raw material costs rise or project delays happen, an expanding order book can compress margins if it isn’t converted efficiently into cash collections.
3. Key Long-Term Investment Triggers
For L&T to remain a reliable long-term investment through 2030, the company must execute on several key priorities:
- High-Quality Cash Conversion: Ensuring that reported accounting profits translate efficiently into free cash flows, avoiding capital traps in long working capital cycles.
- Return on Capital Discipline: Sustaining attractive Returns on Capital Employed (ROCE) across capital-intensive engineering projects.
- Prudent Venture Spending: Scaling high-potential, next-generation ventures like green hydrogen, semiconductor design, and data centers without making excessive upfront capital commitments that dilute group returns.
4. Valuation Context and the 2030 Horizon
The projected 2030 base-case target of ₹5,625 represents an absolute price appreciation of approximately 52% from current reference levels. However, this relies on a stable macroeconomic background and a steady 25x P/E multiple. If execution friction lengthens project timelines or if margin pressures persist, institutional investors may compress multiples toward a bear-case territory (~20x P/E), which could limit long-term share price performance.
Source Quality Report
The following report distinguishes the primary sources used from financial estimates that remain assumptions.
| Information | Source | Source type | Verification |
|---|---|---|---|
| FY2026 revenue, recurring PAT, order book and net debt/equity | L&T FY2026 annual report highlights | Primary | Verified against official disclosure |
| Q1 FY2027 revenue, PAT and margin commentary | L&T Q1 FY2027 earnings-call transcript | Primary | Verified against official transcript |
| Reference share price and NSE P/E | NSE quote page and L&T investor website | Primary | Dated reference data |
| FY2027–FY2031 EPS assumptions | This analysis | Scenario assumptions | Not consensus estimates |
| 2026, 2027 and 2030 price targets | EPS × assumed P/E | Calculated estimates | Arithmetic checked; inputs uncertain |
| Historical valuation range and comparable peer valuation | No complete comparable dataset established | Not verified | Not used as a factual benchmark |
Frequently Asked Questions
What is L&T share price target for 2026?
The illustrative base-case target is ₹3,770, with a bear-case target of ₹2,860 and a bull-case target of ₹4,500. These estimates use assumed EPS and P/E multiples and are not official targets.
What is L&T share price target for 2027?
The base-case estimate is ₹4,050. The bear and bull scenarios are ₹3,050 and ₹5,075, respectively. Actual performance will depend on earnings growth, project execution, margins and market valuation.
What is L&T share price target for 2030?
The illustrative base-case L&T share price target for 2030 is ₹5,625, with a bear case of ₹3,700 and a bull case of ₹7,400. These estimates rely on longer-term EPS assumptions and are consequently more uncertain.
What factors could affect L&T share price?
Key factors include order inflows, revenue growth, project execution, EBITDA margins, operating cash flow, infrastructure spending, international conditions, debt management and the P/E multiple investors assign to its earnings.
What valuation method is used for the target?
The primary method is forward EPS multiplied by an assumed P/E multiple. A full valuation could also include EV/EBITDA, discounted cash flow and sum-of-the-parts analysis, but these have not been independently quantified in this estimate.
What are the major risks to the target?
The principal risks include valuation contraction, earnings slowdown, margin pressure, execution delays, working-capital needs, competition and geopolitical uncertainty affecting international projects.
Disclaimer: These share price targets are scenario-based estimates for educational and informational purposes only. They are not guaranteed price predictions or investment advice. Actual prices may differ materially depending on earnings, valuation, market conditions and company-specific developments.
Does L&T pay dividends?
Yes, L&T regularly distributes dividends to its shareholders. For the financial year ending 2026, the company declared a dividend of ₹38.00 per share with an ex-dividend date of May 22, 2026. This places its current dividend yield at 1.03%.
What is L&T’s business composition?
While widely recognized for large infrastructure execution, L&T is a diversified conglomerate. Its core segments include:
Infrastructure & Engineering Services: ~47% to 68.5% of net revenues (covering buildings, power transmission, and transportation).
Hydrocarbon: ~17.2%.
Hi-Tech Manufacturing & Defense: Processes custom critical equipment, aerospace components, and green hydrogen systems.
IT & Financial Services: Delivered via subsidiaries like LTIMindtree and L&T Finance.
What is the revenue target for L&T by the end of FY26?
Under its five-year strategic roadmap, Lakshya 2026, Larsen & Toubro Limited (NSE:LT / BOM:500510) set a consolidated group revenue target of ₹2.7 trillion (₹2,70,000 crore) by the end of FY26.
The company successfully surpassed this target, closing the FY25–26 fiscal year with a record consolidated revenue from operations of ₹2.86 trillion (₹2,85,874 crore).
Who are the top institutional investors holding L&T stock?
As of 2026, Larsen & Toubro Limited (NSE:LT / BOM:500510) is a professionally managed company with 0% promoter holding. Institutional investors command the largest portion of ownership, collectively holding approximately 62.39% of the company.
The primary institutional categories and top specific holders include:
1. Domestic Institutional Investors (DIIs) — ~43.3%
Life Insurance Corporation of India (LIC): Historically and consistently the single largest domestic institutional shareholder in L&T.
ICICI Prudential Life Insurance Company Limited
NPS Trust A/C UTI Pension Fund Limited
2. Mutual Funds — ~20.10%
A significant number of Indian asset management companies have large exposure to L&T across various diversified equity, large-cap, and infrastructure funds, including:
SBI Mutual Fund
ICICI Prudential Mutual Fund
HDFC Mutual Fund
3. Foreign Institutional Investors (FIIs / FPIs) — ~19.13%
Over 1,180 foreign institutional funds hold a stake in the company. Notable large-scale sovereign and institutional foreign entities include:
Government of Singapore (GIC): Holds a prominent standalone category-I foreign portfolio investment stake (~1.58%).
Vanguard Group (via various emerging markets index funds)
BlackRock (via global passive and active thematic funds)
What is L&T’s revenue target under the new Lakshya 2031 plan?
Under its Lakshya 2031 strategic roadmap, Larsen & Toubro Limited (NSE:LT / BOM:500510) targets a consolidated revenue of ₹5.8 trillion (₹5,80,000 crore) by the financial year 2030–31.
This goal effectively aims to nearly double the company’s revenue from its FY26 base, driven by a projected compounded annual revenue growth rate (CAGR) of 12% to 15% over the five-year plan period. The roadmap hinges heavily on traditional core engineering expansion alongside a ₹43,000–45,000 crore capital expenditure program aimed at future technology-led verticals like green hydrogen, semiconductors, data centers, and AI.
How much capital is L&T investing in semiconductors under the new plan?
Under its Lakshya 2031 strategic roadmap, Larsen & Toubro Limited (NSE:LT / BOM:500510) has earmarked ₹3,000 crore (approximately $300–$350 million) for semiconductor-related investments.
This capital allocation is focused primarily on the fabless chip design space rather than high-cost fabrication, covering intellectual property (IP) acquisition, product design infrastructure, and specialized laboratory facilities. The company has separately noted that it would consider larger, long-term capital allocation for silicon fabrication (over $10 billion) once its chip design pipeline achieves an annual revenue run rate of at least $1 billion.
What is the projected Return on Equity (RoE) target for Lakshya 2031?
Under its Lakshya 2031 strategic roadmap, Larsen & Toubro Limited (NSE:LT / BOM:500510) has set a projected consolidated Return on Equity (RoE) target in the range of 16% to 17%.
The company aims to achieve this threshold by balancing aggressive multi-sector expansion with improved capital efficiency, non-core asset monetization, and technology-driven margin enhancements across its business verticals.
(Note: If you are looking at its subsidiary, L&T Finance Limited, its standalone Lakshya 2031 roadmap outlines a separate financial services target of 16% to 18% RoE by FY31).