

Table of Contents
MCX Gold Price Today | Gold Rate Today
HAL Share Price Target 2026, 2027, 2030
Tata Motors Share Price Target 2026, 2027, 2030
The Indian equity benchmarks tumbled on Monday, October 12, 2026, completely erasing sharp gains recorded during early morning trade. Heavy selling in the banking, IT, and FMCG sectors, coupled with persistent foreign fund outflows, pulled the major indices lower.
Major Indices and Movements
- INDEXBOM:SENSEX: Fell 547.65 points (0.76%) to settle at 71,924.68, down nearly 1,000 points from its intraday high.
- INDEXNSE:NIFTY_50: Dropped 157.10 points (0.70%) to end the session at 22,363.35.
- India VIX: The volatility index jumped over 6%, crossing the 15 mark to reflect mounting investor anxiety.
Key Market Drivers
- Crude Oil Surge: Global Brent crude prices jumped back above $105 per barrel due to escalating tensions and drone/missile strikes in the Middle East, reviving fears of energy-driven inflation.
- FII Selling Pressure: Foreign Institutional Investors extended their multi-session selling streak, severely dragging down large-cap index heavyweights.
- Forex: The Indian Rupee rebounded sharply from historical lows earlier in the day, gaining 91 paise to trade around 95.80 against the US dollar following timely interventions by the Reserve Bank of India.
Sector & Stock Performance
Gainers: Defensive and selective stocks managed to buck the trend. Prominent gainers included Bharat Electronics (NSE:BEL), Mahindra & Mahindra (NSE:M&M), and Kotak Mahindra Bank (NSE:KOTAKBANK).
Laggards: Major index draggers included ITC (NSE:ITC), Tech Mahindra (NSE:TECHM), Hindustan Unilever (NSE:HINDUNILVR), and State Bank of India (NSE:SBIN).
Tomorrow Market Prediction
Sensex Prediction For Tomorrow By Experts
Expert predictions and technical setups for the BSE Sensex (INDEXBOM:SENSEX) ahead of tomorrow’s trading session (Tuesday, October 13, 2026):
Market Sentiment & Technical View
- Bearish Setup: Analysts note that the index formed a “dark cloud cover” pattern after reversing its early gains today. This technical formation suggests that recent positive momentum is losing strength, raising the likelihood of a continued bearish move.
- Key Headwinds: Experts attribute the persistent selling pressure to macro factors, including rising 10-year US Treasury yields (near 5.3%), elevated crude oil prices dampening recovery mood, and continuous foreign institutional investor (FII) outflows.
Key Levels to Watch for Tomorrow
- Support Levels: Immediate psychological and technical support sits around 71,439, followed by stronger support zones at 70,954 and 70,231.
- Resistance Levels: On the upside, experts map out immediate resistance at 72,647. A decisive close above 72,833 would be required to negate the current negative short-term trend and trigger fresh buying momentum.
Expert Trading Strategies
Market analysts suggest tracking action around the immediate support zones. While the broader long-term framework remains cautious due to external variables, defensive sectors or specific large-cap stocks showing fundamental resilience are being favored over broader index bets in the immediate term.
Nifty Prediction For Tomorrow By Experts
Expert technical setups and projections for the Nifty 50 (INDEXNSE:NIFTY_50) ahead of tomorrow’s trading session (Tuesday, October 13, 2026):
Market Sentiment & Technical View
- Bearish Continuation: Following a 0.70% decline today where Nifty closed at 22,363.35, market analysts point out a bearish rejection pattern triggered during early trading. Rallies continue to be aggressively sold into, maintaining a short-term sequence of lower highs and lower lows.
- Macro Triggers: Ongoing foreign institutional investor (FII) outflows, volatile crude oil prices hovering above $105.50, and heightened geopolitical tensions in the Middle East continue to add severe overhead pressure on the index.
- Chart Patterns: Strategists point out that two converging trendlines are forming a potential Falling Wedge or Ending Diagonal pattern, suggesting the index is probing for a structural base.
Key Levels to Watch for Tomorrow
- Support Levels: Experts are closely monitoring immediate support at 22,220 to 22,300. If selling pressure breaks this zone, a structural breakdown past 22,180 could quickly drag the index down to the 21,740 support band.
- Resistance Levels: Immediate dynamic resistance is mapped at 22,410 to 22,430. A stronger supply wall is strongly protected by call writers in the 22,600 to 22,660 cluster; a sustainable breakout above 22,660 is crucial to reverse the near-term negative bias.
Expert Trading Strategies
Due to the persistent pressure on the index, major brokerages recommend a “Sell on Rise” or selective scalping strategy near key overhead resistances until a definitive structural breakout occurs. Heavyweight sectors like Financials and Energy should be watched closely to gauge whether the index can arrest its downward momentum.
Bank Nifty Prediction For Tomorrow By Experts
Expert technical analysis and projections for Nifty Bank (INDEXNSE:NIFTY_BANK) ahead of tomorrow’s trading session (Tuesday, October 13, 2026):
Market Sentiment & Technical View
- Relative Vulnerability: Analysts note that the banking index continues to underperform the broader market. It remains stuck below its critical short-term moving averages, demonstrating a clear “Sell on Rise” structure.
- FII Selling Pressure: Continuous offloading by foreign institutional investors (FIIs) in high-beta banking heavyweights is severely capping any minor intraday pullbacks.
- Key Draggers: Weakness in private sector banking giants is fueling the bearish sentiment, while public sector bank stocks are failing to provide a durable hedge.
Key Levels to Watch for Tomorrow
- Support Levels: Immediate psychological and technical support is placed at 47,200. If this floor gives way, expert consensus indicates the index will rapidly test its critical structural swing low at 46,850.
- Resistance Levels: On the upside, dynamic resistance sits at 47,800. A decisive and sustainable daily close above the 48,250 zone is required to alter the prevailing bearish framework and attract fresh positional long builders.
Expert Trading Strategies
Derivatives analysts report significant Call writing at the 47,800 and 48,000 strikes, suggesting strong overhead supply. Experts recommend avoiding aggressive long positions early in the session and instead looking for short opportunities near major resistance zones, using a strict stop-loss above 48,250.
India Vix
India Vix Chart
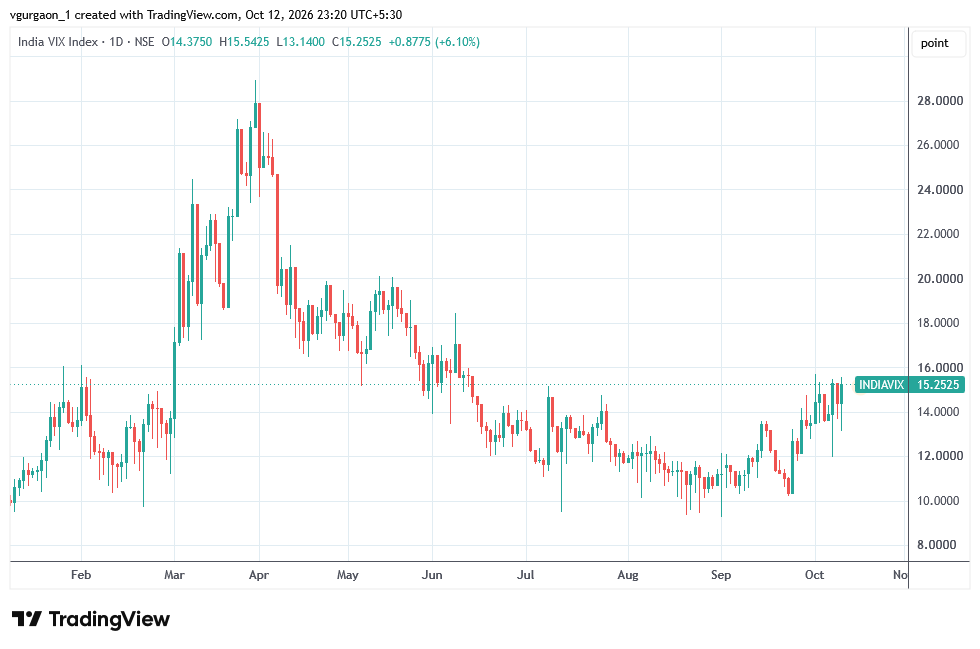
India Vix Today
- Closing Price: 15.25
- Daily Change: Up 6.10% (+0.88 points) from its previous close of 14.38.
- Intraday Range: Touched a high of 15.54 and dropped to a low of 13.14 after opening at 14.38.
Key Volatility Drivers
The spike in the volatility index reflects growing investor anxiety and caution in the near term. Experts point to the following factors driving today’s market stress:
- Market Reversal: The index surged as India’s benchmark equity indices (Nifty 50 and Sensex) completely reversed their early morning gains, closing deeply in the red.
- FII Outflows: Ongoing selling pressure and foreign institutional investor (FII) outflows from domestic equities continue to unnerve local traders.
- Global Factors: Rising domestic bond yields and escalating geopolitical tensions in the Middle East added to the risk-off sentiment, overshadowing minor relief from easing crude oil prices and a stronger rupee.
India Vix Share Price History (Oct 2026)
| Date | Price | Open | High | Low | Change % |
|---|---|---|---|---|---|
| 12-10-2026 | 15.2525 | 13.1400 | 15.5425 | 13.1400 | +6.10% |
| 09-10-2026 | 14.3750 | 15.2750 | 15.2750 | 13.6625 | -5.89% |
| 08-10-2026 | 15.3000 | 11.9675 | 15.4800 | 11.9675 | 10.05% |
| 07-10-2026 | 13.9025 | 13.7325 | 14.3150 | 13.6275 | 2.17% |
| 06-10-2026 | 13.6075 | 14.7750 | 14.7750 | 13.5200 | -7.90% |
| 05-10-2026 | 14.7750 | 14.4550 | 15.3525 | 13.4975 | 2.21% |
| 01-10-2026 | 14.4550 | 13.4900 | 15.6875 | 13.4900 | 7.15% |
India Vix Share Price History (Sept 2026)
| Date | Price | Open | High | Low | Change % |
| 30-09-2026 | 13.4900 | 13.4125 | 13.8625 | 12.7700 | 0.58% |
| 29-09-2026 | 13.4125 | 13.6375 | 14.7700 | 13.2125 | -1.65% |
| 28-09-2026 | 13.6375 | 12.1600 | 14.1450 | 12.1600 | 12.15% |
| 25-09-2026 | 12.1600 | 12.6875 | 12.8350 | 11.7700 | -4.16% |
| 24-09-2026 | 12.6875 | 10.3450 | 13.2175 | 10.3450 | 22.64% |
| 23-09-2026 | 10.3450 | 10.9975 | 11.0425 | 10.2200 | -5.93% |
| 22-09-2026 | 10.9975 | 11.2475 | 11.4125 | 10.6175 | -2.22% |
| 21-09-2026 | 11.2475 | 11.3850 | 11.8250 | 11.1800 | -1.21% |
| 18-09-2026 | 11.3850 | 12.2900 | 12.2900 | 11.3075 | -7.36% |
| 17-09-2026 | 12.2900 | 13.1675 | 13.1675 | 12.1375 | -6.66% |
| 16-09-2026 | 13.1675 | 13.4325 | 13.5825 | 12.8650 | -1.97% |
| 15-09-2026 | 13.4325 | 12.2850 | 13.5850 | 11.9275 | 9.34% |
| 11-09-2026 | 12.2850 | 11.7950 | 12.5650 | 11.0225 | 4.15% |
| 10-09-2026 | 11.7950 | 11.9200 | 11.9600 | 11.5275 | -1.05% |
| 09-09-2026 | 11.9200 | 11.2325 | 12.0500 | 10.5450 | 6.12% |
| 08-09-2026 | 11.2325 | 11.1600 | 11.3950 | 10.4500 | 0.65% |
| 07-09-2026 | 11.1600 | 10.6800 | 11.3475 | 10.2750 | 4.49% |
| 04-09-2026 | 10.6800 | 11.3375 | 11.3375 | 10.5650 | -5.80% |
| 03-09-2026 | 11.3375 | 11.5925 | 11.5925 | 10.7500 | -2.20% |
| 02-09-2026 | 11.5925 | 11.4925 | 12.1125 | 10.5475 | 0.87% |
| 01-09-2026 | 11.4925 | 11.1900 | 12.1225 | 9.2475 | 2.70% |
India Vix Share Price History (Aug 2026)
| Date | Price | Open | High | Low | Change % |
| 31-08-2026 | 11.1900 | 10.6800 | 11.4400 | 10.6800 | 4.78% |
| 28-08-2026 | 10.6800 | 11.0675 | 11.1425 | 10.5325 | -3.50% |
| 27-08-2026 | 11.0675 | 10.5650 | 11.2800 | 10.3550 | 4.76% |
| 26-08-2026 | 10.5650 | 11.0750 | 11.0750 | 10.1300 | -4.60% |
| 25-08-2026 | 11.0750 | 11.5250 | 11.6150 | 9.4500 | -3.90% |
| 24-08-2026 | 11.5250 | 11.1950 | 11.7600 | 10.3225 | 2.95% |
| 21-08-2026 | 11.1950 | 10.7550 | 11.3500 | 9.5700 | 4.09% |
| 20-08-2026 | 10.7550 | 11.3225 | 11.3225 | 9.3325 | -5.01% |
| 19-08-2026 | 11.3225 | 11.3875 | 11.7250 | 10.0600 | -0.57% |
| 18-08-2026 | 11.3875 | 11.3250 | 11.7850 | 10.1400 | 0.55% |
| 17-08-2026 | 11.3250 | 11.3050 | 11.7750 | 11.0925 | 0.18% |
| 14-08-2026 | 11.3050 | 11.4175 | 11.5600 | 10.8250 | -0.99% |
| 13-08-2026 | 11.4175 | 11.6900 | 12.1975 | 10.6525 | -2.33% |
| 12-08-2026 | 11.6900 | 11.8550 | 12.0900 | 11.2575 | -1.39% |
| 11-08-2026 | 11.8550 | 12.2450 | 12.4550 | 11.1925 | -3.18% |
| 10-08-2026 | 12.2450 | 12.1550 | 12.9150 | 10.8150 | 0.74% |
| 07-08-2026 | 12.1550 | 12.1575 | 12.5475 | 11.3000 | -0.02% |
| 06-08-2026 | 12.1575 | 12.0600 | 12.4325 | 10.0950 | 0.81% |
| 05-08-2026 | 12.0600 | 12.1900 | 12.6725 | 10.8050 | -1.07% |
| 04-08-2026 | 12.1900 | 11.9250 | 12.5450 | 11.4275 | 2.22% |
| 03-08-2026 | 11.9250 | 11.7550 | 12.0600 | 11.6950 | 1.45% |
India Vix Share Price History (July 2026)
| Date | Price | Open | High | Low | Change % |
| 31-07-2026 | 11.7550 | 12.1550 | 12.2100 | 11.6450 | -3.29% |
| 30-07-2026 | 12.1550 | 12.0075 | 12.3175 | 11.3025 | 1.23% |
| 29-07-2026 | 12.0075 | 12.5625 | 12.5625 | 11.5625 | -4.42% |
| 28-07-2026 | 12.5625 | 12.6600 | 12.8200 | 11.7225 | -0.77% |
| 27-07-2026 | 12.6600 | 14.0300 | 14.3325 | 12.6025 | -9.76% |
| 24-07-2026 | 14.0300 | 13.4750 | 14.7675 | 13.1800 | 4.12% |
| 23-07-2026 | 13.4750 | 13.2925 | 13.7400 | 12.9150 | 1.37% |
| 22-07-2026 | 13.2925 | 12.6000 | 13.4250 | 11.7250 | 5.50% |
| 21-07-2026 | 12.6000 | 12.9800 | 13.0800 | 12.0975 | -2.93% |
| 20-07-2026 | 12.9800 | 13.1500 | 13.8425 | 12.8925 | -1.29% |
| 17-07-2026 | 13.1500 | 12.8825 | 13.3500 | 12.8100 | 2.08% |
| 16-07-2026 | 12.8825 | 13.2700 | 13.2700 | 12.7750 | -2.92% |
| 15-07-2026 | 13.2700 | 13.7500 | 13.8725 | 13.0400 | -3.49% |
| 14-07-2026 | 13.7500 | 13.2800 | 13.8650 | 11.6575 | 3.54% |
| 13-07-2026 | 13.2800 | 12.2525 | 13.5225 | 9.4750 | 8.39% |
| 10-07-2026 | 12.2525 | 13.3625 | 13.3625 | 12.1275 | -8.31% |
| 09-07-2026 | 13.3625 | 14.6800 | 14.6800 | 13.0675 | -8.97% |
| 08-07-2026 | 14.6800 | 11.6475 | 15.1600 | 11.3350 | 26.04% |
| 07-07-2026 | 11.6475 | 11.8175 | 11.9350 | 11.0550 | -1.44% |
| 06-07-2026 | 11.8175 | 11.7975 | 12.3575 | 11.7025 | 0.17% |
| 03-07-2026 | 11.7975 | 12.2875 | 12.2875 | 11.6500 | -3.99% |
| 02-07-2026 | 12.2875 | 13.2425 | 13.2925 | 12.1925 | -7.21% |
| 01-07-2026 | 13.2425 | 13.6000 | 14.0725 | 13.1500 | -2.63% |