

Table of Contents
The Indian defence sector is undergoing a structural transformation driven by indigenous manufacturing, rising defence spending, technology development and efforts to reduce dependence on imports. Companies operating in specialised defence engineering, optics, optronics and space-related systems are positioned to participate in this changing industrial landscape.
FII Buying Defense Stocks: Top Defense Stocks FIIs Are Buying in India
Paras Defence and Space Technologies is one of the companies operating in these technology-intensive segments. However, a growing defence industry alone does not guarantee that a company will deliver sustainable earnings growth or attractive shareholder returns.
FII Buying Defense Stocks: Top Defense Stocks FIIs Are Buying in India
This Paras Defence stock analysis examines its business model, historical financial performance, order book, growth drivers, competitive advantages, cash-flow quality, risks and potential earnings trajectory over the next 3–5 years.
The central question is: Can Paras Defence translate defence-sector opportunities and its order pipeline into consistent revenue growth, improving profitability and stronger free cash flow?
Research date and methodology
This article uses FY2025–26 consolidated figures from the company’s annual reporting information and available FY2026–27 disclosures. Scenario projections are analytical assumptions, not management guidance or guaranteed outcomes. Current valuation and quarterly details should be verified against the latest exchange filings before publication.
1. Executive Growth Verdict (Paras Defence stock analysis)
The following is a preliminary evidence-based assessment of the company’s growth profile. It is not a complete investment rating because detailed current valuation, cash-flow statements, segment economics and management guidance require further verification.
| Growth Factor | Preliminary Assessment |
| Industry growth opportunity | Positive structural drivers |
| Revenue growth | Strong FY26 reported growth |
| Order book visibility | Meaningful order book |
| Technology intensity | Specialised defence capabilities |
| Margin potential | Improved in FY26 |
| Cash-flow quality | Requires detailed verification |
| Growth sustainability | Dependent on execution |
| Valuation | Must be assessed against current market price and earnings |
Key Factors That Could Drive Growth
1. Expanding defence and aerospace opportunities
India’s focus on domestic defence production can create opportunities for specialised suppliers, engineering companies and technology providers.
2. Order book supporting revenue visibility
The company’s consolidated closing order book increased to ₹986 crore at the end of FY2025–26, according to available annual reporting information. This provides an indicator of potential future execution, but order book value does not automatically equal near-term revenue or profit.
3. Improvement in FY26 financial performance
Consolidated revenue, EBITDA and PAT increased in FY2025–26 compared with FY2024–25. Whether this performance can be repeated depends on order execution, product mix, margins and cash conversion.
2. Paras Defence Business Model and Growth Engine
What Does Paras Defence Do?
Paras Defence operates in defence and space technology-related products and engineering solutions. Its reported customer base includes government defence organisations, shipyards, aerospace companies and international defence technology companies.
Its areas of business include specialised optical and optoelectronic systems and defence engineering capabilities.


Major Business Segments
According to FY2025–26 annual reporting information, the consolidated revenue mix was approximately:
| Business Segment | Share of FY26 Revenue |
| Optics & Optronic Systems | 42% |
| Defence Engineering | 46% |
| Subsidiary businesses | 12% |
These percentages describe the reported FY26 consolidated revenue mix. The future growth rate of each segment, its profitability and the contribution from new products should be examined using the detailed annual report.
Primary Growth Engines
- Defence engineeringPotential growth through execution of specialised defence projects, product development and new orders.
- Optics and optronicsDemand for precision optical and electro-optical technologies across defence and related applications.
- Space and satellite communicationOpportunities from specialised systems and technology development, including the announced DRDO order for Ku/C-Band satellite communication phased-array antennas for airborne applications in April 2026.
- Domestic defence manufacturingPotential opportunities from indigenous procurement and the development of local defence supply chains.
The importance of each growth engine should be measured through actual order inflows, revenue contribution, profitability and capital requirements—not just the attractiveness of the sector.
3. Historical Financial Performance
A useful way to evaluate a defence manufacturing company is to examine whether revenue growth is accompanied by sustainable EBITDA, PAT and cash-flow expansion.
Revenue, EBITDA and PAT: FY2021–FY2025
The following figures are consolidated and taken from the company’s FY2024–25 annual report.
| Financial Year | Revenue (₹ Cr) | EBITDA (₹ Cr) | PAT (₹ Cr) |
| FY21 | 143.33 | 43.40 | 15.79 |
| FY22 | 182.56 | 51.85 | 27.08 |
| FY23 | 222.43 | 56.75 | 35.94 |
| FY24 | 253.50 | 51.05 | 30.04 |
| FY25 | 364.66 | 97.20 | 61.49 |
Source: Paras Defence Annual Report FY2024–25.
FY2026 Financial Update
The FY2025–26 consolidated results provide the more recent full-year reference point.
| Metric | FY25 | FY26 |
| Revenue from operations | ₹364.66 Cr | ₹476.57 Cr |
| EBITDA | ₹97.20 Cr | ₹120.46 Cr |
| PAT | ₹61.49 Cr | ₹89.46 Cr |
| Closing order book | ₹928 Cr | ₹986 Cr |
What Does the Growth Trend Show?
- Revenue: Increased meaningfully in FY26 compared with FY25.
- EBITDA: Increased, although EBITDA growth was lower than revenue growth.
- PAT: Increased faster than revenue in FY26, which warrants examination of operating performance, finance costs, taxes and exceptional items.
- Order book: Increased year-on-year, but order execution and replenishment remain important.
The available figures support the observation that FY26 was a stronger financial year than FY25. They do not, on their own, establish that the company will maintain a particular growth rate for the next five years.
4. Quality of Growth: Is Profit Growth Translating Into Cash Flow?
Revenue and PAT growth are important, but investors should also examine whether the company is generating sufficient operating cash flow to support expansion.
A company can report strong accounting profits while experiencing cash-flow pressure due to:
- Increasing receivables.
- Inventory buildup.
- Delayed customer payments.
- High working-capital requirements.
- Large capital expenditure.
- Advance payments to suppliers.
Key Financial Ratios to Monitor
| Ratio | Why It Matters |
| CFO / PAT | Measures operating cash generation relative to accounting profit |
| FCF / PAT | Examines cash available after capital expenditure |
| CFO / EBITDA | Helps assess operating cash conversion |
| Receivables / Revenue | Tracks working-capital pressure |
| Inventory / Revenue | Identifies potential inventory accumulation |
| Revenue CAGR vs PAT CAGR | Compares sales growth with profit growth |
Important: The FY2025–26 annual reporting information includes an exceptional item in consolidated results. Investors should examine the audited cash-flow statement and the notes to accounts to distinguish recurring earnings from exceptional effects.
A complete assessment of CFO/PAT and FCF/PAT requires the detailed cash-flow figures. These ratios should not be presented as verified until the relevant financial statements have been reviewed.
5. Defence Industry Growth and Total Addressable Market
India’s defence manufacturing sector is supported by several long-term themes:
Structural Growth Drivers
- Greater focus on indigenous defence manufacturing.
- Modernisation of military equipment and technology.
- Demand for advanced surveillance, optics and electronic systems.
- Development of domestic aerospace and space capabilities.
- Opportunities for Indian suppliers in global defence value chains.
However, the total defence budget should not be treated as the addressable market for every company. Paras Defence’s realistic TAM depends on the specific products it can manufacture, its certifications, technological capabilities, customer eligibility and ability to win contracts.
What Should Investors Examine?
- Which products account for the largest share of revenue?
- What proportion of the market can the company realistically serve?
- Does it have proprietary technology or established customer qualifications?
- Are competitors expanding capacity in the same product categories?
- Can the company win export contracts without excessive customer concentration?
The company’s reported customer relationships include government entities, defence companies and international organisations, providing context for its market positioning. Customer concentration and the financial contribution of individual customers still require detailed examination.
6. Competitive Position and Market Share
Paras Defence operates in specialised areas where technological capabilities, product qualification and customer relationships can be important competitive factors.
Potential comparison groups include:
| Company / Group | Relevant Comparison Area |
| Bharat Electronics | Defence electronics and systems |
| Astra Microwave Products | Defence and microwave technology |
| Data Patterns | Defence electronics and engineering |
| Bharat Dynamics | Defence systems and products |
| Specialised private defence manufacturers | Product-specific competition |
These businesses are not identical. Their product mix, business models, order structures and scale differ. A meaningful peer comparison should use comparable reporting periods and relevant operating segments.
Competitive Advantages to Investigate
- Product development capabilities.
- Qualification and certification requirements.
- Established relationships with defence customers.
- Manufacturing expertise.
- Technology partnerships.
- Ability to execute complex orders.
- Export opportunities.
A company’s presence in a strategically important sector does not automatically establish market leadership. Market share must be supported by product-level industry data or company disclosures.
7. Capacity Expansion and Capital Expenditure
Defence manufacturing growth requires more than receiving new orders. The company must have sufficient capacity, technical personnel, equipment and working capital to execute projects.
Important Expansion Questions
| Question | Why It Matters |
| What is current manufacturing capacity? | Establishes the starting point |
| How much capacity is utilised? | Identifies available operating headroom |
| What capex is planned? | Indicates future investment requirements |
| How will expansion be funded? | Assesses balance-sheet impact |
| What revenue can new capacity generate? | Tests expansion economics |
| What is the expected return on capital? | Examines shareholder value creation |
The company has reported continued investment in its technology and manufacturing base, but the return on future capex must be evaluated using project-specific financial details.
Investor takeaway: A large expansion announcement is not sufficient evidence of profitable growth. The critical factors are execution timelines, utilisation, customer demand, margins and cash generation.
8. Order Book and Revenue Visibility
The closing order book is one of the key forward indicators for Paras Defence.
Order Book Trend
| Financial Year | Closing Order Book |
| FY21 | ₹215.09 Cr |
| FY22 | ₹301.85 Cr |
| FY23 | ₹393.01 Cr |
| FY24 | ₹630.00 Cr |
| FY25 | ₹928.00 Cr |
| FY26 | ₹986.00 Cr |
Source: Company annual reporting information.
The order book increased from ₹928 crore in FY25 to ₹986 crore in FY26. This represents approximately 6.3% year-on-year growth, calculated from the reported figures.
Is the Order Book Enough to Guarantee Growth?
No. An order book is an indicator of contracted work, but actual revenue depends on:
- Execution schedule.
- Customer acceptance and milestones.
- Availability of components.
- Manufacturing capacity.
- Contract terms.
- Potential delays or cancellations.
The order-book-to-revenue ratio for FY26 was approximately 2.07x, using ₹986 crore of closing orders and ₹476.57 crore of FY26 consolidated revenue. This is a simple comparison, not a forecast of how many years of revenue the order book guarantees.
9. Management Guidance and Execution
Management guidance is useful when it is compared with actual historical performance.
What Investors Should Track
- Revenue growth targets.
- EBITDA margin expectations.
- Order inflow targets.
- Capacity additions.
- New product launches.
- Export expansion.
- Capital expenditure plans.
Management statements should be distinguished from independently verified outcomes. The company’s official investor-relations page provides annual reports, financial results and corporate announcements for this research.
Management Credibility Checklist
| Area | Monitoring Question |
| Revenue guidance | Were previous targets achieved? |
| Order inflow | Are new orders replenishing execution? |
| Capex | Are projects completed on schedule? |
| Margin guidance | Are margins sustainable? |
| Cash flow | Is profit converting into cash? |
| Capital allocation | Are investments generating appropriate returns? |
Without a full record of historical guidance and subsequent performance, a definitive management-credibility score would be premature.
10. Balance Sheet and Funding Capacity
A strong balance sheet can provide flexibility during an industry expansion. A weak balance sheet can constrain growth even when demand is strong.
The FY2025–26 reporting information describes the company as having limited long-term debt and financial flexibility. This should be verified through the audited balance sheet and debt notes before drawing a comprehensive conclusion.
Key Balance Sheet Metrics
| Metric | Importance |
| Net debt | Measures overall debt burden |
| Debt / EBITDA | Indicates debt relative to operating earnings |
| Interest coverage | Assesses ability to service interest |
| Current ratio | Examines short-term liquidity |
| Promoter pledging | Identifies pledged share exposure |
| Working capital | Measures funding needs |
| Contingent liabilities | Identifies potential obligations |
Growth can be internally funded when operating cash flows and existing liquidity are sufficient. However, major expansion could require additional borrowing or equity funding. The actual funding requirement depends on the scale and timing of planned investments.
11. Promoter and Institutional Ownership
Smart money analysis can complement fundamental research, but ownership changes should not be treated as proof of future stock performance.
Ownership Trends to Examine
- Promoter shareholding over the last 4–8 quarters.
- Promoter buying or selling.
- Promoter pledge levels.
- FII and DII holding changes.
- Mutual fund ownership.
- Bulk and block deals.
- Changes in institutional concentration.
An HDFC Securities research report cited a March 2026 promoter holding of 53.2%, with no pledged shares reported in the displayed data. This is a historical snapshot and should be updated with the latest exchange shareholding disclosure.
For the WealthCreatorz Smart Money Tracker, the most useful approach is to connect ownership data with revenue growth, order execution, valuation and cash flow.
12. Earnings Quality and Forensic Red Flags
Defence manufacturing businesses can experience uneven revenue recognition because projects may be executed in phases and depend on customer milestones.
Red Flags to Monitor
- Receivables growing faster than revenue.
- Persistent negative free cash flow despite rising PAT.
- Unexpected margin expansion.
- Frequent equity dilution.
- Unusual related-party transactions.
- Large exceptional gains.
- Repeated project execution delays.
- Dependence on a limited number of customers.
Questions for Forensic Analysis
- Is revenue growth supported by operating cash flow?
- Are receivables and inventory growing in line with business activity?
- Is the company capitalising expenses appropriately?
- Are exceptional items affecting reported profitability?
- Are related-party transactions disclosed transparently?
A verified earnings-quality score should be calculated only after reviewing the complete audited financial statements and relevant notes.
13. Future Earnings Model: 3–5 Year Scenarios
A scenario model helps investors understand how different growth assumptions can affect future earnings. It should not be mistaken for a price target or a guaranteed outcome.
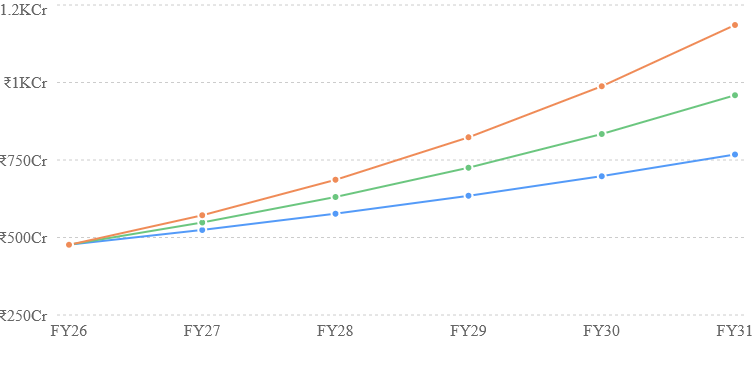
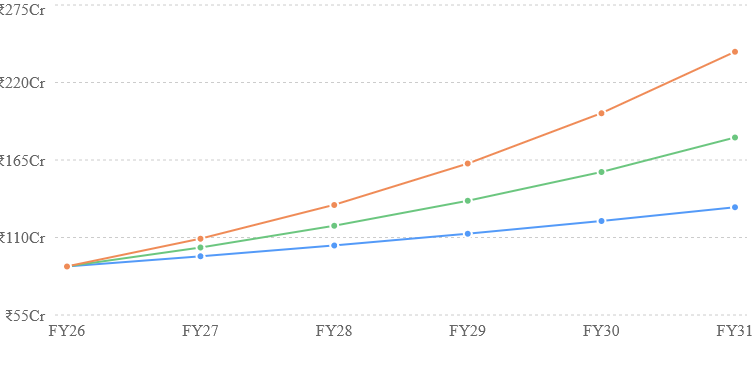
The following is an illustrative model, not a company forecast. It uses FY26 consolidated revenue of ₹476.57 crore and PAT of ₹89.46 crore as the starting point. The scenarios assume different revenue and PAT growth rates for demonstration.
Scenario Assumptions
| Scenario | Revenue CAGR | PAT CAGR |
| Bear | 10% | 8% |
| Base | 15% | 15% |
| Bull | 20% | 22% |
These rates are analytical assumptions and are not derived from verified management guidance or a fully modelled industry forecast.
Illustrative Revenue Projection
Share
Chart options
Illustrative PAT Projection
Share
Chart options
How to Interpret the Model
The base case assumes 15% annual revenue and PAT growth. The bull case assumes faster revenue expansion and stronger PAT compounding, while the bear case assumes slower growth.
Actual results could differ significantly due to order execution, product mix, cost inflation, capital requirements, taxation and competition.
The model does not provide an estimated stock price or investment return. A valuation model requires verified share count, current market price, net debt and earnings forecasts.
14. Potential Growth Catalysts
The following are potential business catalysts to monitor. Their actual impact and probability have not been independently rated.
| Potential Catalyst | Timeframe | What to Monitor |
| New defence orders | 0–12 months | Order value and execution |
| Satellite communication products | 0–3 years | Product development and commercialisation |
| Domestic defence procurement | 1–5 years | Eligible contracts and wins |
| Capacity expansion | 1–3 years | Commissioning and utilisation |
| Export growth | 1–5 years | Export revenue and customer diversification |
| Product launches | 0–3 years | Customer adoption and margins |
| Operating leverage | 1–3 years | EBITDA margin and capacity utilisation |
| Order replenishment | Ongoing | New orders relative to execution |
The company announced a DRDO order of approximately ₹7.72 crore in April 2026 for the development of Ku/C-Band satellite communication phased-array antennas for airborne applications. This is a documented order announcement, but its contribution to long-term revenue and profits requires additional information.
15. Risks to the Growth Thesis
Even companies operating in attractive industries can experience weak returns when growth expectations are not achieved or valuations become excessive.
| Risk | Potential Impact | Monitoring Indicator |
| Order execution delays | Revenue recognition may be postponed | Order execution and milestone updates |
| Customer concentration | Dependence on major customers | Customer mix |
| Valuation compression | Stock price may decline despite business growth | Forward valuation vs earnings |
| Working capital | Cash flow pressure | Receivables and inventory |
| Competition | Pressure on market share and margins | Order wins and product pricing |
| Technology changes | Product obsolescence risk | R&D and product pipeline |
| Capacity constraints | Limits revenue growth | Capacity utilisation |
| Cost inflation | Reduced profitability | Gross and EBITDA margins |
| Funding requirements | Additional debt or dilution | Capex and cash balances |
| Contract risk | Delays or cancellations | Order-book quality and disclosures |
The probability and financial impact of each risk require company-specific evidence. They should not be assigned arbitrary numerical ratings.
16. Growth vs Valuation
A high-growth business can still be an expensive investment if its market valuation already assumes aggressive future earnings.
Valuation Metrics to Examine
- Price-to-earnings ratio (P/E).
- Forward P/E.
- EV/EBITDA.
- Price-to-book ratio.
- Free cash flow yield.
- PEG ratio.
- Historical valuation range.
- Comparison with relevant peers.
A historical market-data source displayed a high trailing P/E for Paras Defence, but the exact current valuation must be checked using the latest market price and updated financial results.
Four Questions Before Interpreting Valuation
- Is the expected earnings growth achievable?
- Is the current valuation higher than comparable companies?
- Can margins improve without disproportionate capital expenditure?
- Is the valuation supported by cash generation?
A company’s industry prospects and historical earnings growth should be evaluated separately from whether its current share price adequately compensates for risk.
17. Three-to-Five-Year Investment Thesis
Why the Business Could Grow
- Exposure to specialised defence and space technology applications.
- Potential for continued domestic defence procurement.
- Existing order book and product development opportunities.
- Possibility of capacity utilisation and operating leverage improvements.
- Potential expansion into new customers and export markets.
These are potential drivers, not a guarantee that all will materialise.
Why the Growth Thesis Could Fail
- Order execution could fall short of expectations.
- New capacity may not generate expected returns.
- Competitive pressure could reduce margins.
- Cash conversion could remain weaker than accounting profits.
- High valuation could limit returns even if the business expands.
What Must Go Right?
- Consistent order inflow and execution.
- Sustainable profitability across business segments.
- Effective working-capital management.
- Successful product and capacity expansion.
- Disciplined capital allocation.
What Would Make the View Change?
- Persistent order execution weakness.
- Material deterioration in margins or cash flow.
- Unexpected balance-sheet stress.
- A sustained reduction in growth expectations.
- Evidence of weaker competitive positioning.
18. Final Growth Scorecard
A numerical scorecard should be based on verified and comparable information. The table below provides a framework for evaluating the company without assigning unsupported scores.
| Factor | Evaluation Required |
| Industry growth | Industry-specific demand and growth data |
| TAM / runway | Product-level addressable market |
| Revenue growth | Multi-year and quarterly growth |
| Earnings growth | EBITDA, PAT and EPS trajectory |
| Margin potential | Product mix and operating leverage |
| Market-share potential | Relevant market data |
| Competitive advantage | Technology and customer qualification |
| Capacity expansion | Capacity, capex and utilisation |
| Order visibility | Order book quality and execution |
| Cash-flow quality | CFO, FCF and working capital |
| Balance sheet | Debt, liquidity and funding |
| Management execution | Guidance vs actual performance |
| Capital allocation | Returns on incremental capital |
| Institutional accumulation | Latest shareholding trends |
| Valuation | Current price relative to earnings |
| Overall growth prospects | Combined evidence |
Why avoid a premature score? A score out of 10 can give a false impression of precision when several critical financial and valuation inputs have not yet been independently verified.
Frequently Asked Questions (FAQs)
What does Paras Defence do?
Paras Defence and Space Technologies operates in specialised defence and space technology-related businesses, including optics, optronics and defence engineering.
What is the Paras Defence order book?
The company’s reported consolidated closing order book was ₹986 crore at the end of FY2025–26.
Can Paras Defence grow revenue by more than 15% annually?
A revenue CAGR above 15% is a possible analytical scenario, but it cannot be established as a reliable forecast without assessing future order inflows, execution capacity, industry demand and management guidance.
Is Paras Defence a defence manufacturing company?
Yes. It operates in defence-related engineering and technology businesses, including optics and optronics. Its precise manufacturing activities and product-level revenue contributions should be reviewed in the annual report.
What are the major risks in Paras Defence?
Key areas to monitor include order execution, competition, working capital, valuation, customer concentration and capacity expansion.
How should investors track Paras Defence’s smart money signals?
Monitor quarterly promoter, FII, DII and mutual fund shareholding disclosures alongside financial performance, order book and valuation. Ownership changes should be used as supplementary evidence rather than a standalone investment signal.
Conclusion: Paras Defence Growth Prospects
Paras Defence operates in specialised defence and space technology areas, and its reported FY2025–26 performance shows improvement in revenue, EBITDA and PAT compared with FY2024–25. The company also reported a consolidated closing order book of ₹986 crore, providing an important indicator for monitoring future execution.
However, long-term sustainable compounding depends on more than industry growth and order-book size. Investors need to assess whether the company can consistently execute orders, maintain profitability, generate free cash flow and earn attractive returns on incremental capital.
| year | bear | base | bull |
|---|---|---|---|
| FY26 | 476.57 | 476.57 | 476.57 |
| FY27 | 524.23 | 548.06 | 571.88 |
| FY28 | 576.65 | 630.27 | 686.26 |
| FY29 | 634.32 | 724.81 | 823.51 |
| FY30 | 697.75 | 833.53 | 988.21 |
| FY31 | 767.52 | 958.56 | 1,185.85 |
| year | bear | base | bull |
|---|---|---|---|
| FY26 | 89.46 | 89.46 | 89.46 |
| FY27 | 96.62 | 102.88 | 109.14 |
| FY28 | 104.35 | 118.31 | 133.15 |
| FY29 | 112.7 | 136.06 | 162.44 |
| FY30 | 121.72 | 156.47 | 198.18 |
| FY31 | 131.46 | 180.94 | 241.78 |
Paras Defense Share Price Target
As of 24 September 2026, Paras Defence & Space Technologies was around ₹1,361.75 on NSE, with a market capitalisation of about ₹10,974 crore. Its reported TTM P/E was approximately 110x, versus a sector P/E of about 54x.
That high valuation makes a conventional price-target approach highly sensitive to future EPS growth and the P/E multiple investors are willing to pay.
Current analyst target
The currently available analyst-consensus data is extremely limited: Marketscreener shows one analyst with a target of ₹820, while Investing.com likewise reports a ₹820 12-month target based on one analyst.
Because this is only one analyst’s estimate, I would not treat ₹820 as a consensus target.
My scenario-based valuation framework
Using the currently reported TTM EPS of roughly ₹11.90 as a starting point, here’s what different combinations of EPS growth and future P/E could imply:
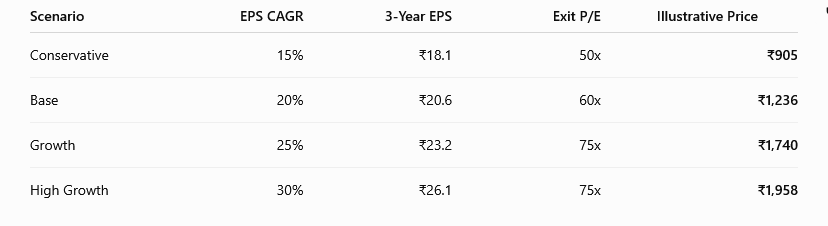
These are my mathematical valuation scenarios, not analyst targets or forecasts. They demonstrate how much growth Paras Defence would need to justify different valuations.
Why the stock needs strong earnings growth
The company is growing: the latest available data shows Q1 FY28 revenue of about ₹129.85 crore, up 35.9% YoY, with net profit of ₹20.74 crore.
At the same time, the stock’s valuation is already demanding. At roughly 110x TTM earnings, even strong business growth may not necessarily translate into equivalent share-price appreciation if the P/E multiple contracts.
The company also has several fundamental growth drivers, including defence and space technology exposure and a substantial order pipeline. Recent reporting puts the closing order book at roughly ₹986 crore for FY26.
A useful 3–5 year framework
For your WealthCreatorz article, I’d frame the potential levels this way rather than presenting one “guaranteed” target:
3-year scenario range: approximately ₹900–₹1,950
5-year valuation: depends much more heavily on actual EPS compounding. If EPS compounds at 20–25% for five years and the eventual P/E remains around 50–75x, the mathematical range becomes considerably wider.
The key variables to track every quarter are:
- Revenue growth above 15–20%
- PAT growth relative to revenue
- Order-book growth and execution
- EBITDA margin
- Free-cash-flow conversion
- FII/DII and mutual-fund holding
- New defence/space orders
- Capacity expansion
- Current P/E versus forward EPS growth
Bottom line: At around ₹1,362, the market is already assigning Paras Defence a very high earnings multiple. The important question isn’t simply whether the company can grow; it’s whether earnings can grow fast enough for several years to justify that valuation.