

Table of Contents
Analysis date: 12 October 2026 · NSE: M&M · BSE: 500520
Mahindra & Mahindra is a diversified Indian automotive, farm equipment and financial-services group. Its future share price will depend on SUV demand, tractor sales, operating margins, new product launches, earnings growth and the valuation investors are willing to pay.
MCX Gold Price Today | Gold Rate Today
HAL Share Price Target 2026, 2027, 2030
Tata Motors Share Price Target 2026, 2027, 2030
The company reported consolidated revenue of ₹58,188 crore and profit after tax (PAT) of ₹5,455 crore for Q1 FY2027, representing year-on-year growth of 28% and 34%, respectively. Its automotive and farm businesses remain important growth drivers, while its services businesses add diversification.
The following Mahindra & Mahindra share price target for 2026, 2027 and 2030 is an independent, scenario-based valuation exercise, not an official company forecast or a guaranteed price prediction.
Mahindra & Mahindra Share Price Target 2026
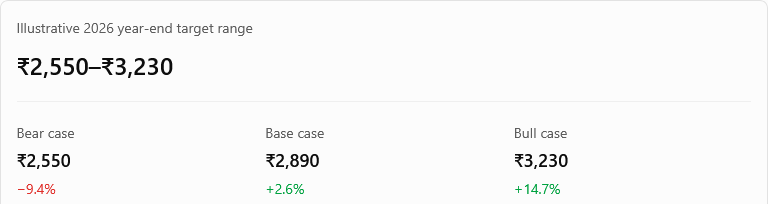
1. Mathematical Breakdown of the Scenarios
Using the provided metric of a projected FY2027 Earnings Per Share (EPS) of ₹170 and the baseline reference stock price of ₹2,815.45, the implied targets and percentage potential moves are as follows:
- Bear Case (15x earnings): Implies a price target of ₹2,550 (a downward correction of -9.43%).
- Base Case (17x earnings): Implies a price target of ₹2,890 (a modest expansion of +2.65%).
- Bull Case (19x earnings): Implies a price target of ₹3,230 (an upward trajectory of +14.72%).
This mathematical spread emphasizes the text’s final conclusion: even assuming positive future earnings growth up to ₹170 per share, the Base Case scenario provides a limited valuation margin of safety (+2.65% upside) relative to the closing market price on October 12, 2026.
2. Operational Drivers & Tailwinds
The positive performance of Mahindra & Mahindra’s equity depends largely on its Sport Utility Vehicle (SUV) division. Strong urban and aspirational demand for consumer vehicles, coupled with increasing vehicle assembly volumes, acts as the primary defense against margin contraction. Sustaining high delivery rates on backlogged vehicle queues is critical to testing the Bull Case.
3. Macroeconomic Risks & Headwinds
Conversely, the pressure pushing the stock toward the Bear Case scenario is tied to cyclical vulnerabilities:
Subdued Tractor Demand: Unlike the urban-driven SUV segment, M&M’s large tractor and farm equipment portfolio is exposed to rural cash flows and agricultural economic health. Slower monsoons or weak rural income trends directly suppress tractor sales volumes.
Commodity Cost Inflation: Rising input prices (such as steel, rubber, and precious metals) compress operational margins if costs cannot be effectively passed to consumers.
Mahindra & Mahindra Share Price Target 2027
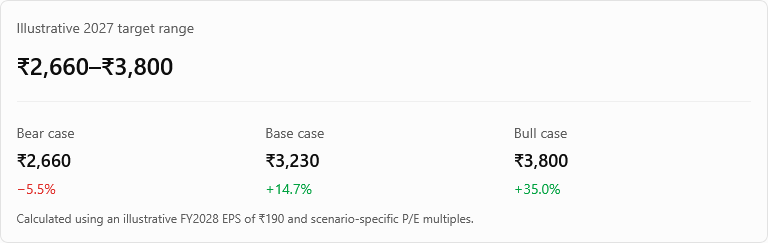
The analysis relies on a projected FY2028 Earnings Per Share (EPS) of ₹190. Using the October 2026 reference price of ₹2,815.45 (from previous market data), the implied potential performance for each scenario breaks down as follows:
- Bear Case (14x earnings): Implies a price target of ₹2,660, representing a -5.52% downside risk compared to the October 2026 baseline. This assumes that even if earnings expand, structural headwinds severely contract the valuation multiple.
- Base Case (17x earnings): Implies a price target of ₹3,230, representing a modest upside potential of +14.72%.
- Bull Case (20x earnings): Implies a price target of ₹3,800, indicating a strong +34.97% upside rally if investor sentiment lifts the multiple alongside solid execution.
2. Market Dominance vs. Margin Compression
The operational data from Q1 FY2027 emphasizes that volume growth alone does not guarantee equivalent profit expansion:
- Market Share Strength: Mahindra maintains highly defensive market leadership, capturing 25.0% of the SUV revenue market share and a dominant 44.9% of the tractor market share.
- Strong Volume Trajectory: Volumes continue to expand rapidly, with SUVs up 15% year-over-year and tractors growing 18% year-over-year.
- The Operational Catch: Despite high demand, operating margins in both the automotive and farm equipment segments remain under pressure. This pressure underscores the risk that rising input or operational costs could restrict earnings from reaching the projected ₹190 EPS target.
3. Key Variables to Watch in 2027
For the stock to shift toward the Bull Case rather than the Bear Case, Mahindra must convert volume growth into profit by managing two main variables:
Margin Stabilization: Price increases or operational cost efficiencies will be necessary to offset input cost pressures and support the expansion of the P/E multiple.
Rural Purchasing Power: Tractor volumes remain heavily dependent on rural income health, which dictates the sustainability of the 18% volume growth.
Mahindra & Mahindra Share Price Target 2030
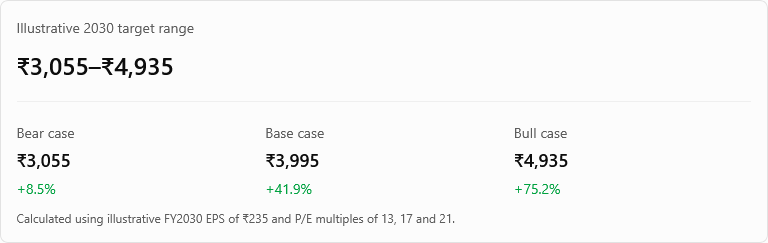
The core target projections rely on the company hitting a projected FY2030 Earnings Per Share (EPS) of ₹235 (representing an 11.4% annualized growth rate from FY2026). Based on the explicit analytical multiples provided, the targets unfold as follows:
- Bear Case (13x multiple): Implies a 2030 target price of ₹3,055. Under this framework, structural headwinds or market corrections downrate the multiple, compressing returns even as absolute earnings scale upward.
- Base Case (17x multiple): Implies a 2030 target price of ₹3,995. This case balances a normalized structural multiple with the projected 54% growth in underlying earnings power.
- Bull Case (21x premium multiple): Implies a 2030 target price of ₹4,935. This scenario requires flawless fundamental execution paired with a persistent valuation premium, which the analysis cautions should not be treated as a baseline expectation.
2. Operational Matrix: Core Long-Term Structural Growth Drivers
To realize the base or bull targets by 2030, Mahindra & Mahindra must successfully execute across five core thematic pillars:
Capital Allocation Disciplines: Protecting structural margins and return on equity (ROE) via strict balance-sheet management and avoiding cash-dilutive projects.
Electric Vehicle (EV) Transition: Successfully transitioning its dominant internal combustion engine (ICE) SUV footprint into competitive, high-volume electric model segments.
Agricultural Equipment & Mechanization: Expanding beyond traditional tractors into advanced farm mechanization tools to drive sustained multi-year rural revenue growth.
Ecosystem Monetization: Capturing secondary value creation through its diversified group verticals, specifically inside financial services, technology platforms, and logistics networks.
Mahindra & Mahindra Share Price Target 2026, 2027, 2030: Bull vs Base vs Bear
The following consolidated table summarises the illustrative price targets using the same earnings and valuation assumptions discussed above.
| Target year | Bear case | Base case | Bull case | Base-case calculation |
|---|---|---|---|---|
| 2026 | ₹2,550 | ₹2,890 | ₹3,230 | ₹170 × 17 |
| 2027 | ₹2,660 | ₹3,230 | ₹3,800 | ₹190 × 17 |
| 2030 | ₹3,055 | ₹3,995 | ₹4,935 | ₹235 × 17 |
All amounts are per share. These are scenario calculations, not official targets or consensus estimates. The 2026 and 2027 targets use illustrative FY2027 and FY2028 EPS, respectively; the 2030 targets use illustrative FY2030 EPS.
What do these targets imply?
- 2026: The base case implies limited upside from the October reference price because the assumed earnings growth is partly reflected in the current valuation.
- 2027: The base case assumes continued earnings growth and a 17-times P/E multiple.
- 2030: The base case implies approximately 42% price appreciation over the reference price, before dividends, across a period of more than four years.
The longer-term figures are particularly sensitive to the EPS assumptions. Even if the company delivers earnings growth, a lower market valuation could limit shareholder returns.
How We Calculated the Mahindra & Mahindra Share Price Target
1. Business and growth outlook
Mahindra & Mahindra operates across several businesses, including:
- Automotive: SUVs, electric vehicles, light commercial vehicles and other mobility products.
- Farm equipment: tractors, agricultural machinery and related solutions.
- Financial services: vehicle finance and other financial products.
- Technology services, logistics, hospitality, real estate and other businesses within the group.
Its diversified business model provides multiple earnings drivers. However, consolidated earnings also reflect the performance of subsidiaries and other businesses, so they should not be interpreted as automotive earnings alone.
2. Financial performance
The latest available company results as of 12 October 2026 are for Q1 FY2027, covering the quarter ended 30 June 2026.
Reported financial data · Figures in ₹ crore unless otherwise stated
| Financial metric | FY2025 | FY2026 | Q1 FY2027 |
|---|---|---|---|
| Consolidated revenue | 1,59,211 | 1,98,639 | 58,188 |
| Consolidated PAT | 12,929 | 17,099 | 5,455 |
| Consolidated PAT margin | 8.1% | 8.6% | 9.4% |
| Consolidated EPS | — | ₹152.20 | ₹48.60 |
Sources: M&M FY2026 results and Q1 FY2027 results. Annual and quarterly figures cover different periods; they should not be compared as if they represent equivalent reporting periods.
FY2026 standalone operating performance was also strong:
| Standalone metric | FY2025 | FY2026 | YoY growth |
|---|---|---|---|
| Revenue | ₹1,18,625 crore | ₹1,47,765 crore | 25% |
| EBITDA | ₹18,416 crore | ₹22,490 crore | 22% |
| EBITDA margin | 15.5% | 15.2% | Lower |
| PAT | ₹11,855 crore | ₹15,639 crore | 32% |
Source: M&M’s official FY2026 results.
The figures indicate substantial revenue and profit growth. However, the slight decline in standalone EBITDA margin shows why future profitability needs to be monitored alongside sales growth.
3. Cash flow and balance-sheet strength
M&M’s FY2026 annual report provides the following balance-sheet and cash-flow indicators:
| Metric | FY2026 | FY2025 |
|---|---|---|
| Standalone debt-to-equity | 0.01× | 0.02× |
| Standalone interest coverage | 77.8× | 62.0× |
| Standalone return on equity | 23.0% | 20.8% |
| Consolidated operating cash flow | ₹11,657 crore | ₹3,176 crore |
The standalone debt-to-equity ratio and interest coverage figures indicate a strong position at the parent-company level. Consolidated operating cash flow also improved significantly. These figures should not be mixed across reporting scopes when evaluating the financial position of the group.
A comparable FY2026 ROCE figure and a consistently calculated consolidated free-cash-flow figure were not established from the official excerpts reviewed for this analysis. They are therefore not presented as verified figures here.
4. Valuation assumptions
Value Research reported the following valuation metrics for M&M as of 9 October 2026:
| Metric | Reported value |
|---|---|
| Share price | ₹2,796.20 |
| Trailing P/E | 18.8× |
| Price-to-book | 3.53× |
| EV/EBITDA | 10.4× |
| Five-year median P/E | 22.98× |
| Five-year median P/B | 3.77× |
Source: Value Research, market data as of 9 October 2026.
The current valuation appears moderate relative to the stock’s five-year median P/E, although that comparison alone does not establish that the stock is undervalued.
The historical median is not a guaranteed fair value. Future returns will depend on whether M&M sustains earnings growth and whether the market maintains, increases or reduces its valuation multiple.
Peer P/E comparisons also require care because automotive manufacturers differ in product mix, growth rates, capital intensity and profitability.
5. EPS projections for FY2027–FY2030
The following are my illustrative scenario assumptions, not official guidance or verified analyst consensus estimates.
| Financial year | Illustrative EPS | Assumed annual growth |
|---|---|---|
| FY2026 reported | ₹152.20 | — |
| FY2027 estimate | ₹170 | 11.7% |
| FY2028 estimate | ₹190 | 11.8% |
| FY2029 estimate | ₹211 | 11.1% |
| FY2030 estimate | ₹235 | 11.4% |
The assumptions reflect continued growth in vehicle and farm-equipment earnings, contributions from other group businesses and a broadly stable long-term competitive position. Actual EPS could differ materially because of margins, taxes, exceptional items, subsidiary performance and changes in the number of shares outstanding.
6. Target-price calculations
The basic valuation formula is:
\[ \text{Target price}=\text{Estimated EPS}\times\text{Assumed P/E} \]
For the base case:
- 2026: ₹170 × 17 = ₹2,890
- 2027: ₹190 × 17 = ₹3,230
- 2030: ₹235 × 17 = ₹3,995
The 17-times base-case multiple is below the reported five-year median P/E of 22.98 times. It is an illustrative assumption intended to avoid relying on a return to the stock’s historical median valuation.
The lower bear-case multiples reflect slower growth or valuation de-rating. The higher bull-case multiples require stronger earnings delivery and sustained investor confidence.
Key Factors That Could Drive Mahindra & Mahindra Share Price
1. The Automotive Core: High-Volume SUV & Commercial Performance
The near-term trajectory of the stock hinges on its core automotive operations. Market gains are driven by product pipelines and backlog clearance schedules:
- The Execution Multiplier: Sustained top-line growth relies on high manufacturing output and the successful rollout of updated vehicle variants. New model cycles draw consumers, protecting market share from domestic and global competitors.
- The Volatility Risk: Because consumer discretionary spending changes dynamically, a sudden slowdown in high-margin utility vehicle segments directly threatens projected automotive revenue.
2. The Next Generation Paradigm: Electric Vehicle (EV) Monetization
Securing long-term value depends on shifting from Internal Combustion Engines (ICE) to electric platforms. Success in this category requires balancing three key operational priorities:
- Consumer Adoption & Acceptance: Ensuring new electric platforms resonate with mainstream consumers.
- Scale and Assembly Efficiency: Reducing battery procurement costs and factory overhead to establish structural cost advantages.
- Defensible Product Pricing: Protecting core unit economics and margins from price wars launched by competing manufacturers.
3. The Cyclical Engine: Tractor Volumes & Rural Economics
While SUVs dominate urban markets, the farm equipment sector drives rural profitability. This business segment remains exposed to cyclical, climate-driven macro factors:
- Environmental Factors: Rainfall patterns and groundwater health directly affect rural crop yields and agricultural income.
- Financial Factors: Favorable commodity pricing for farm yields and accessible crop financing terms determine whether dealers can move inventory efficiently.
4. Financial Quality: The Margin and Cash Flow Connection
Top-line sales expansion is a weak metric unless it actively increases per-share value:
- Profitable Scale: Expansion only benefits shareholders when the company contains input cost inflation and expands its operating margins.
- Capital Protection: Sustained growth in Earnings Per Share (EPS) and free cash flow generation enables the company to reinvest internally without relying on expensive debt markets.
5. Multi-Sector Exposure: Assessing Group Entities
Evaluating M&M requires analyzing its broader corporate structure. Its diversified holdings introduce distinct growth paths and capital demands:
- Subsidiary Tracking: Contributing business lines—spanning financial services, IT consulting, and logistics networks—must be evaluated independently based on their unique capital configurations.
- Capital Allocation Disciplines: The parent company must ensure that capital consumed by secondary businesses does not dilute overall corporate returns or drag down the group’s return on equity (ROE).
Risks to the Mahindra & Mahindra Share Price Target
1. Valuation Risk & Multiple De-rating
A primary risk to the 2030 targets is valuation uncertainty:
- The Valuation Drag: As seen in the analytical scenarios, even if M&M achieves its base case FY2030 target of ₹235 EPS, a contraction in investor sentiment that drops the P/E multiple down to 13x (the Bear Case) keeps the share target limited to ₹3,055.
- Multiple Compression: If macroeconomic expansion slows down or sector-wide growth decelerates, multiple contraction can completely erase the stock price gains typically generated by absolute earnings growth.
2. Supply Side Headwinds: Input Cost Inflation
Top-line vehicle sales do not automatically translate into bottom-line profits due to supply chain dynamics:
- Raw Material Fluctuations: Industrial manufacturing remains highly sensitive to cyclical spikes in the costs of steel, aluminum, rubber, and specialty components.
- Margin Erosion: When price competition or soft consumer sentiment prevents M&M from passing these incremental input costs directly to buyers, the resulting margin compression slows down EPS growth.
3. Structural Exposure to Rural Cyclicality
M&M’s high-margin farm equipment and tractor business exposes it to rural economic shifts:
- Climate Risks: Slower or irregular monsoon cycles directly impact agricultural crop volumes and depress aggregate rural cash flows.
- Credit Conditions: A reduction in rural purchasing power, paired with tighter or more expensive crop financing options, can rapidly stall tractor replacement cycles and impact dealer network turnover.
4. Competitive Intensification & Segment Execution
Defending its market footprint requires consistent, well-executed product cycles:
- Market Share Erosion: Aggressive vehicle rollouts or discounting strategies from domestic auto rivals can compress M&M’s 25.0% SUV revenue market share.
- Execution Volatility: Heavy capital expenditures allocated toward expanding manufacturing lines and building out next-generation Electric Vehicle (EV) platforms carry structural execution risks. If consumer adoption rates lag or new models face delays, the capital spent could dilute the company’s return profile.
5. Macroeconomic and Group Contagion
As a large, diversified conglomerate, M&M remains exposed to external financial pressures:
- Credit Vulnerabilities: Inside the financial services division, spikes in credit costs or an increase in non-performing assets (NPAs) can reduce consolidated group earnings.
- Macro Headwinds: Sustained inflation, high baseline interest rates, and drops in consumer confidence can damp down buyer appetite for big-ticket auto loans, slowing long-term growth.
Is Mahindra & Mahindra a Long-Term Growth Story?
1. Structural Advantages and Recent Momentum
Mahindra & Mahindra’s long-term growth is supported by its fundamental positioning:
- Dual-Segment Market Power: M&M holds a strong position in both urban and rural auto segments, backed by a 25.0% revenue market share in SUVs and a 44.9% market share in tractors as of Q1 FY2027.
- Solid Revenue Foundation: Financial momentum is anchored by its FY2026 performance, which generated a consolidated revenue of ₹1,98,639 crore and a profit after tax (PAT) of ₹17,099 crore (EPS of ₹152.20).
2. The Core Strategic Requirements
For M&M to move from basic volume growth to true wealth generation for shareholders, its management must execute efficiently across several key operational areas:
- Margin Integrity: Top-line growth must be managed alongside solid operational margins to prevent raw material inflation from diluting earnings.
- EV Product Adoption: Navigating the capital-heavy shift toward electric vehicles requires strong product acceptance and manufacturing efficiency to ensure long-term profitability.
- ** Conglomerate Capital Management:** Managing the credit costs and capital requirements of its various group businesses (such as technology, logistics, and financial services) is essential to avoid diluting parent returns.
3. Valuation Sensitivity Framework
The analysis models a base-case target price of ₹3,995 by 2030. This projection depends on two specific factors:
- Earnings Growth: Annualized consolidated EPS must grow at an estimated 11.4% rate over four years to reach ₹235.
- Multiple Stability: The market must consistently value those earnings at a structural baseline of 17 times.
If structural headwinds lead to a de-rating of the stock to a 13x multiple (the Bear Case), the target drops to ₹3,055, demonstrating how changes in market sentiment can impact ultimate investor returns even if absolute earnings increase.
Frequently Asked Questions
1. What is Mahindra & Mahindra share price target for 2026?
The illustrative year-end 2026 targets are ₹2,550 in the bear case, ₹2,890 in the base case and ₹3,230 in the bull case. They use assumed FY2027 EPS of ₹170 and P/E multiples of 15, 17 and 19, respectively.
2. What is Mahindra & Mahindra share price target for 2027?
The illustrative 2027 targets are ₹2,660, ₹3,230 and ₹3,800 for the bear, base and bull cases. The base case assumes FY2028 EPS of ₹190 and a 17-times P/E multiple.
3. What is Mahindra & Mahindra share price target for 2030?
The illustrative 2030 targets are ₹3,055 in the bear case, ₹3,995 in the base case and ₹4,935 in the bull case. These calculations assume FY2030 EPS of ₹235, with valuation multiples ranging from 13 to 21 times.
4. What factors could affect Mahindra & Mahindra share price?
The main factors include SUV and commercial-vehicle sales, tractor demand, EV adoption, operating margins, commodity prices, earnings growth, competition, subsidiary performance and the valuation multiple assigned by the market.
5. What valuation method is used for the target?
The analysis uses an EPS multiplied by P/E valuation method. Estimated EPS is multiplied by different valuation multiples to construct bear, base and bull scenarios. The assumptions are compared with historical valuation data and the company’s reported earnings performance.
6. What are the major risks to the target?
The main risks are earnings slowdown, margin pressure, commodity inflation, weaker rural demand, competition, EV execution challenges and valuation de-rating. These factors could cause actual prices to differ materially from the scenario targets.
What is M&M’s historical average P/E multiple over the past decade?
Over the past decade, the trailing twelve months (TTM) price-to-earnings (P/E) ratio for Mahindra & Mahindra Ltd (INDEXNSE:M&M) has traded at a median of 18.56. During this 10-year period, its valuation multiple has fluctuated from a minimum low of 9.91 to an extreme maximum peak of 462.23.
What caused M&M’s P/E ratio to peak historically?
The historical spikes in Mahindra & Mahindra’s P/E ratio—most notably the extreme anomaly skewing toward its lifetime peak—were caused by a severe compression in corporate earnings rather than an expansion in stock price.
In the stock market, the P/E multiple mathematically spikes when the “E” (Earnings Per Share) plummets toward zero while the “P” (Share Price) remains relatively stable or drops at a much slower rate. M&M’s historical peak was triggered by two primary compounding events:
1. The 2020–2021 Severe Profit Crash
During the COVID-19 pandemic and the subsequent global economic disruptions of FY2021, M&M’s financial performance faced deep operational challenges. Total automotive volume sales plunged globally and domestically, resulting in a dramatic 97% drop in consolidated net profits during hit quarters (such as Q1 FY21).
2. Massive Subsidiary Write-offs and Impairments
Beyond manufacturing halts, M&M took heavy, one-time financial hits by booking asset impairments and credit provisions. Substantial loss-provisions inside its global business subsidiaries and spikes in credit costs at Mahindra & Mahindra Financial Services heavily diluted the parent company’s consolidated net profit pool.
Because equity investors treated this collapse in net profits as temporary and maintained long-term confidence in the brand’s vehicle pipeline, the share price did not crash at the same scale as the earnings. This mathematical divergence caused the trailing TTM P/E ratio to briefly soar to its historic peak before normalizing as earnings recovered heavily in subsequent fiscal years.
How much did M&M’s consolidated EPS rebound following the FY21 profit crash?
Following the pandemic-induced profit crash of FY2021, Mahindra & Mahindra Ltd (EXCHANGE:SYMBOL not found for M&M; please use NSE:M&M) experienced a substantial turnaround driven by a strict capital reallocation program, restructuring of underperforming international subsidiaries, and booming domestic SUV demand.
On a standalone level, M&M’s EPS grew from a low of ₹8.24 in FY2021 to ₹40.73 in FY2022, a recovery of roughly 394%.
On a consolidated group level (incorporating continuing and discontinued operations), the profit rebound resulted in a 57% Compound Annual Growth Rate (CAGR) in consolidated Earnings Per Share between FY2021 and FY2025, ultimately surging to ₹152.20 by FY2026.
How does M&M’s return on equity (ROE) compare to other major Indian auto manufacturers?
As of 2026, Mahindra & Mahindra Ltd’s consolidated Return on Equity (ROE) stands at 20.3%. This reflects a strong, highly profitable combination of premium SUV momentum and tractor market leadership.
When compared to other major Indian automobile manufacturers, M&M’s return profile ranks favorably against traditional players but is surpassed by luxury-driven setups:
Maruti Suzuki India Ltd: M&M outperforms Maruti Suzuki, which reports a steady but lower consolidated ROE of 14.3% to 14.5%, held back by slower demand in the entry-level small car segment.
Tata Motors Ltd (Consolidated): Tata Motors historically holds a higher consolidated ROE of 28.1%, strongly driven by the outsized performance and margins of its luxury Jaguar Land Rover (JLR) subsidiary.
Tata Motors Passenger Vehicles (TMPV): Looking strictly at domestic retail car operations following internal segmentations, TMPV trails dramatically with a negative trailing ROE of -24.07%, highlighting M&M’s superior domestic execution.
Hyundai Motor India Ltd: Hyundai tracks slightly ahead of M&M with an efficient asset turnaround, printing an ROE of 30.3%.
What are the primary operational metrics needed to track M&M’s EV execution?
To evaluate whether Mahindra & Mahindra Ltd (INDEXNSE:M&M) can successfully turn its electric vehicle (EV) investments into sustainable profits by 2030, you need to track five core operational metrics:
1. EV Volume Mix & Segment Penetration
What to track: The percentage of M&M’s total SUV sales that come from battery electric vehicles (BEVs) each quarter.
Why it matters: This tracks consumer adoption. If M&M is to hit its multi-year expansion targets, its upcoming “Born Electric” (BE) platform models must scale rapidly to replace internal combustion engine (ICE) volumes without diluting market share.
2. Battery Pack Cost per Kilowatt-Hour ($/kWh)
What to track: The localized input cost of cell and pack assemblies sourced via supply chain partners.
Why it matters: The battery pack is the single most expensive component in an EV. Tracking localized battery assembly helps determine whether M&M can manufacture vehicles efficiently enough to maintain structural price competitiveness against lower-cost entrants.
3. Gross Margin per Unit (EV vs. ICE)
What to track: The manufacturing gross profit margin generated by an electric SUV compared to a traditional diesel/petrol vehicle.
Why it matters: Early EV production lines typically experience margin compression due to high component costs and low initial capacity utilization. Reaching margin parity with its traditional ICE portfolio is a key indicator that M&M’s EV division has achieved profitable scale.
4. Direct Production Capacity Utilization
What to track: Actual EV assembly output compared to the total installed annual plant capacity.
Why it matters: Fixed-cost absorption is highly sensitive to factory utilization rates. Running plants at a high utilization rate is necessary to distribute manufacturing overhead and optimize the return on capital spent on dedicated EV lines.
5. Charging Ecosystem Partner Integrations
What to track: The total number of operational fast-charging stations accessible through M&M’s integrated grid partnerships.
Why it matters: EV vehicle acceptance is heavily dependent on infrastructure availability. A lack of reliable high-speed charging options directly limits consumer confidence and slows down the sales velocity of newly launched premium electric SUVs.
Source Quality Report
The analysis prioritises the company’s official results and annual report for financial facts. A reputable financial-data provider is used for dated market valuation data, and MarketWatch is used for the 12 October closing-price reference.
| Information | Source | Source type | Date | Verified? |
|---|---|---|---|---|
| Financial performance | M&M FY2026 results | Primary | 5 May 2026 | Yes |
| Latest quarterly results | M&M Q1 FY2027 results | Primary | 30 July 2026 | Yes |
| Balance-sheet ratios | FY2026 annual report | Primary | FY2026 | Yes |
| Cash flow | Consolidated cash-flow statement | Primary | FY2026 | Yes |
| Market price and valuation | Value Research market data | Secondary | 9 October 2026 | Yes, for the stated date |
| Closing-price reference | MarketWatch price report | Secondary | 12 October 2026 | Reported |
| EPS projections and targets | This analysis | Scenario assumptions | 12 October 2026 | Calculated, not externally verified forecasts |
Disclaimer: These share price targets are scenario-based estimates for educational and informational purposes only. They are not guaranteed price predictions or investment advice. Actual prices may differ materially depending on earnings, valuation, market conditions and company-specific developments.
1 thought on “Mahindra & Mahindra Share Price Target 2026, 2027, 2030”