
Table of Contents
The ITC share price target 2026, 2027, 2030 depends on the recovery in cigarette-business profitability, growth in the FMCG business, input-cost trends and the valuation investors are willing to pay for its earnings.
ITC’s latest available quarterly results as of 9 October 2026 are for Q1 FY2027, ended 30 June 2026. The company’s official results statement reported that standalone net revenue declined 14% year-on-year and EBITDA and profit after tax (PAT) fell 28% and 27%, respectively. FMCG and paper businesses nevertheless reported growth, highlighting the difference between the performance of individual businesses and the group total
MCX Gold Price Today | Gold Rate Today
HAL Share Price Target 2026, 2027, 2030
Tata Motors Share Price Target 2026, 2027, 2030
The stock also faces uncertainty following the sharp increase in cigarette taxes in February 2026 and a substantial reduction in GQG-linked holdings.
ITC Share Price Target By 2026
| Scenario | Target for 2026 | Change from ₹266.20 |
|---|---|---|
| Bear case | ₹240 | -9.8% |
| Base case | ₹290 | +8.9% |
| Bull case | ₹330 | +24.0% |
The scenario estimates outlined reflect the core theme driving investor sentiment for ITC Limited (NSE:ITC): managing the structural tax shocks introduced earlier this year alongside the steady progression of its diversified businesses.
Background on the 2026 Core Catalyst
The “tax changes” mentioned refer to a major regulatory overhaul effective February 1, 2026, when cigarette taxation transitioned from a 28% GST plus compensation cess structure to a flat 40% GST. Simultaneously, a steep revised specific excise duty ranging between ₹2,050 and ₹8,500 per 1,000 sticks was applied. This resulted in an unprecedented 60% to 65% aggregate increase in tax incidence on the sector, requiring retail price increases of up to 35% to fully pass through costs.
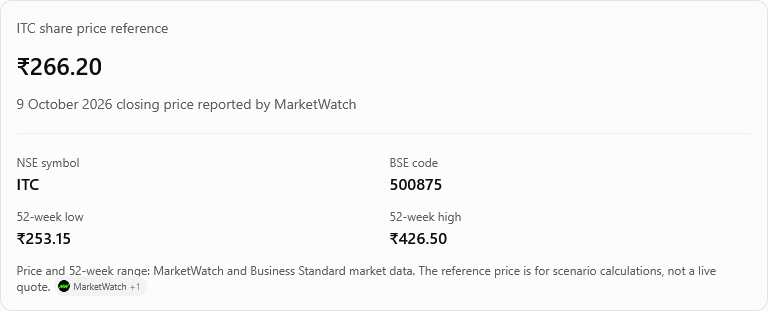
The stock has corrected roughly 27% year-to-date in 2026, touching 52-week lows near ₹253. This makes the scenario targets highly dependent on the operational levers described below.
Scenario Breakdown & Strategic Drivers
1. Bear Case (Target: ₹240)
- Operational Trigger: Staggered price hikes fail to offset compressed margins, and aggressive pricing shocks cause severe volume de-growth.
- Market Risk: Excessive legal taxation historically accelerates consumer migration toward India’s massive illicit cigarette trade, which completely evades taxation.
- Valuation Impact: If the cigarette segment—which traditionally delivers 75% to 80% of corporate profits—sees a permanent structural squeeze, the market derates ITC’s overall price-to-earnings (P/E) multiple.
2. Base Case (Target: ₹290)
- Operational Trigger: ITC successfully deploys its calibrated portfolio re-architecting strategy. Rather than implementing a massive one-time price shock, management staggers the hikes to protect consumer franchises and sequentially recapture margin levels.
- Segment Diversification: The “FMCG-Others” segment (packaged foods, personal care) maintains resilient double-digit topline expansion, serving as a stabilizer while the paperboard and agricultural channels recover.
- Valuation Impact: Major institutional consensus aligns with this conditional rebound. Major global brokerages upgraded ITC to a ‘Buy’ in October 2026 with a price target near ₹300, noting that the worst of the earnings downgrade cycle has passed and roughly 75% of the tax burden has already been absorbed via consumer pricing.
3. Bull Case (Target: ₹330)
Valuation Impact: Valuation multiples expand as investors award a premium for macro-resilience, pushing the stock price closer toward historical structural averages.
Operational Trigger: Underlying consumer demand proves remarkably inelastic. Volumes remain flat or recover faster than modeled into the final calendar stretch, allowing per-stick profitability to fully return to pre-tax-hike thresholds by fiscal year-end.
Segment Catalysts: Non-tobacco operations perform robustly, potentially assisted by tailwinds like moderating wood costs in the paperboards segment or external margin improvements in agribusiness.
ITC Share Price Target By 2027
| Scenario | Target for 2027 | Change from ₹266.20 |
|---|---|---|
| Bear case | ₹240 | -9.8% |
| Base case | ₹310 | +16.5% |
| Bull case | ₹370 | +39.0% |
The scenario framework presented for ITC Limited (NSE:ITC) reflects a crucial transitional period. The focus of the financial markets has shifted from the immediate shock of the structural tax overhaul to how successfully the company recovers its earnings power into 2027.
1. Understanding the Catalyst: Post-Tax Shock Recovery
The “February 2026 cigarette-tax changes” refer to a significant regulatory shock where the tax structure shifted to a flat 40% GST accompanied by highly aggressive increases in specific excise duties. This forced retail price hikes of 25% to 35% across ITC’s core portfolio to pass on the costs.
Because cigarettes historically generate 75% to 80% of ITC’s overall corporate profits, the price elasticity of demand and the subsequent volume trajectory are the largest variables determining whether the stock hits the Bear, Base, or Bull targets by 2027.
2. Deconstructing the Q1 FY2027 Operational Signals
The Q1 FY2027 numbers cited provide a strong early look into management’s “ITC Next” diversification strategy, showing that non-tobacco engines are executing well:
- FMCG Resilience: A 12% YoY revenue growth (and 16% excluding staples) paired with a 21% surge in segment PBIT proves that premium brands (e.g., Aashirvaad, Sunfeast, Bingo!) are gaining pricing power and operating leverage.
- Paperboards Rebound: The paper segment’s 38% PBIT growth signifies a strong cyclical recovery, likely aided by easing domestic wood costs and optimized capacity utilization at its major manufacturing units.
However, as the text notes, because cigarettes dominate the bottom line, non-tobacco outperformance must be paired with cigarette volume stabilization to ensure a total corporate earnings recovery.
3. Scenario Analysis & Market Pricing Mechanics
Base Case (Target: ₹310 | +16.5%)
- The Thesis: Cigarette volumes gradually find a floor as consumers adjust to the higher post-tax retail prices. Simultaneously, staggered pricing strategies by management successfully recapture compressed margins.
- Market Dynamic: Combined with compounding profits from the FMCG and Paper businesses, overall corporate earnings begin normalizing. The market rewards this earnings visibility with a modest re-rating, pushing the stock back above the ₹300 mark.
Bull Case (Target: ₹370 | +39.0%)
- The Thesis: Cigarette demand proves to be highly inelastic, with volumes rebounding faster than institutional models anticipate.
- Market Dynamic: FMCG segment margins expand into the high single digits, and cyclical tailwinds boost the hotels and agribusinesses. Institutional investors return to the stock for its defensive characteristics and high dividend yield, driving a sharp expansion of its Price-to-Earnings (P/E) multiple.
Bear Case (Target: ₹240 | -9.8%)
Market Dynamic: Volume de-growth in the core tobacco business offsets the strong operational gains seen in the FMCG and paper units, leading to stagnant net profit growth and keeping the stock under technical selling pressure.
The Thesis: The steep tax hikes cause persistent margin compression, or trigger structural consumer migration toward the illicit, untaxed cigarette trade.
ITC Share Price Target By 2030
| Scenario | Target for 2030 | Change from ₹266.20 |
|---|---|---|
| Bear case | ₹260 | -2.3% |
| Base case | ₹415 | +55.9% |
| Bull case | ₹565 | +112.2% |
The 2030 long-term scenario framework for ITC Limited (NSE:ITC) reflects a structural valuation inflection point. It shifts the focus from simple year-to-year operational recoveries to the fundamental terminal value of the conglomerate as its revenue mix transforms over the decade.
The following sections break down the core levers driving these target projections:
1. The Core Paradox: Gross vs. Consolidated Earnings
The data cited from the Q1 FY2027 statement perfectly demonstrates why institutional investors treat a simple revenue jump with caution. Following the aggressive cigarette taxation overhaul implemented in February 2026, ITC’s gross revenues expanded by 28%. However, because net revenue dropped by 14.4% and standalone Profit After Tax (PAT) slid by 27% (to ₹3,579 crore), the quarter exposed how tax structures directly erode corporate margins.
For ITC to achieve its long-term targets, the growth discussion up to 2030 must focus on consolidated earnings per share (EPS) expansion rather than top-line volumes alone.
2. Strategic Long-Term Drivers for 2030
- FMCG Scale & Profitability Optimization: The “ITC Next” corporate plan focuses heavily on improving EBITDA margins within the non-cigarette consumer business. While staples provide high-volume distribution, the ultimate goal for 2030 is scaling premium personal care, value-added foods, and newer items (Sresta, Sproutlife). A sustained expansion of these segments helps reduce the structural risk discount applied to the stock by environmental, social, and governance (ESG) mandates.
- Tobacco Elasticity and Counter-Illicit Strategy: Cigarettes remain the primary cash engine generating the capital needed to fund the rest of the business. By 2030, the primary goal is ensuring that the legal industry can successfully claw back market share from untaxed, illicit alternatives, while implementing disciplined, incremental price increases to defend its margin baseline.
- Capital Allocation & Consolidated Returns: Historically, ITC traded at a discount due to capital-intensive investments in its low-margin agri-trading networks and luxury hotel pipelines. With the demerger and standalone listing of ITC Hotels Limited tracking through 2026, corporate capital allocation has become much more focused. This streamlined focus directly improves return on equity (ROE) and capital employed (ROCE).
3. Scenario Mechanics & Multiple De-risking
The baseline calculation assumes a launch point from the ₹266 level, which reflects a roughly 30% year-to-date correction in 2026. The market is pricing the stock at compressed historical valuations (roughly 17x FY27 estimated earnings).
ITC Share Price Target By 2026, 2027, 2030: Bull vs Base vs Bear
The consolidated table summarizes the illustrative targets. These scenarios are based on different assumptions about earnings recovery and valuation; they are not analyst consensus estimates.
| Year | Bear case | Base case | Bull case | Key assumption |
|---|---|---|---|---|
| 2026 | ₹240 | ₹290 | ₹330 | Cigarette-business adjustment and early earnings recovery |
| 2027 | ₹240 | ₹310 | ₹370 | Improving earnings visibility and continued FMCG growth |
| 2030 | ₹260 | ₹415 | ₹565 | Long-term earnings growth and potential valuation changes |
Reference price: ₹266.20 on 9 October 2026. Price changes shown earlier are calculated against this reference. Targets exclude dividends.
How We Calculated the ITC Share Price Target
The principal method is the forward price-to-earnings (P/E) approach:
Target Price=Estimated EPS×Assumed P/E\text{Target Price}=\text{Estimated EPS}\times\text{Assumed P/E}Target Price=Estimated EPS×Assumed P/E
For context, ITC reported FY2026 earnings per share of ₹16.20. Its annual results also reported standalone gross revenue of ₹80,867.49 crore, up 10.1% year-on-year, and EBITDA of ₹25,208.22 crore, up 4.9%.
A valuation reference from Morningstar dated 1 October 2026 showed a current P/E of 16.16 times and a five-year average of 23.94 times. These are secondary-source valuation metrics and may differ depending on the earnings period and calculation method.
For the forward calculations below, the EPS figures and multiples are my illustrative assumptions, not company guidance or verified consensus forecasts.
| Year | Bear EPS × P/E | Base EPS × P/E | Bull EPS × P/E |
|---|---|---|---|
| 2026 | ₹16 × 15 = ₹240 | ₹16.1 × 18 ≈ ₹290 | ₹16.5 × 20 = ₹330 |
| 2027 | ₹16 × 15 = ₹240 | ₹17.2 × 18 ≈ ₹310 | ₹18.5 × 20 = ₹370 |
| 2030 | ₹20 × 13 = ₹260 | ₹23.1 × 18 ≈ ₹415 | ₹26.9 × 21 ≈ ₹565 |
The calculations use rounded EPS and P/E assumptions. Actual earnings may differ substantially, particularly because cigarette taxation and pricing decisions can affect ITC’s profitability.
Why use these multiples?
- Bear case: Lower multiples reflect weaker earnings visibility, slower growth or sustained regulatory pressure.
- Base case: An 18-times multiple assumes earnings stabilize and ITC retains the characteristics of an established consumer-products business.
- Bull case: A higher multiple assumes stronger earnings growth, successful execution and improved investor confidence.
The 2030 base-case target requires EPS to rise from ₹16.20 in FY2026 to approximately ₹23.10 by FY2030. That represents roughly 9.3% annual EPS growth over four years. This is a scenario assumption, not a verified earnings forecast.
The 2030 bull case requires approximately ₹26.90 EPS and a 21-times P/E. It therefore depends on both earnings growth and the market maintaining a higher valuation multiple.
1. Sector Performance Analysis & Key Levers
- FMCG Diversification: ITC’s “FMCG-Others” segment represents the crown jewel of its long-term transformation strategy [1]. By scaling premium consumer brands, management aims to shift the core business profile toward a high-growth consumer staples model, which helps reduce the environmental, social, and governance (ESG) risk discounts historically applied to tobacco firms.
- Tobacco Elasticity and Tax Squeeze: Following the heavy structural cigarette-tax overhaul implemented in February 2026, the core priority has focused entirely on passing through costs through staggered, calibrated price adjustments without triggering massive volume de-growth or pushing consumers toward illicit, untaxed trade channels [1].
- Paperboards, Paper & Packaging: This vertical acts as a strategic B2B anchor, driving structural margins through value-added product categories, sustainable packaging developments, and export opportunities [1].
- Fresh Food Acceleration: The Q1 FY2027 performance highlights a powerful emerging growth engine, with the fresh-food business posting a 90% year-on-year surge in Gross Merchandise Value (GMV) and crossing an annualized revenue run rate of ₹300 crore [1]. This points to accelerating market share gains in organized agritech and modern retail networks.
2. Corporate Structure and Financial Flexibility
- Demergers and Value Unlocking: The mention of ITC Hotels Limited reflects an active corporate restructuring process. Tracking through 2026, the strategic demerger and separate public listing of the hospitality business will remove high capital-expenditure obligations from the parent company’s balance sheet, structurally improving Return on Capital Employed (ROCE).
- Robust Income Stream Generation: The ₹14.50 per share total dividend payout reported for fiscal year 2026 underscores ITC’s cash-generative power [1]. The company continues to maintain a dividend payout ratio of roughly 80% to 85%, positioning it as a highly reliable defensive anchor for institutional portfolios amid wider market volatility.
Financial Performance: What Investors Should Watch
| Metric | FY2026 standalone | Q1 FY2027 standalone |
|---|---|---|
| Gross revenue | ₹80,867.49 crore | ₹26,794.47 crore |
| EBITDA | ₹25,208.22 crore | ₹4,514 crore |
| EBITDA growth | +4.9% YoY | -27.9% YoY |
| PAT | See annual results filing | ₹3,579 crore |
| PAT growth | — | -27.1% YoY |
1. Deconstructing the Q1 FY2027 Margin Compression
The core takeaway from the data table is the severe decoupling of gross revenue from operational profits. In Q1 FY2027, despite booking a robust gross revenue of ₹26,794.47 crore, ITC experienced a steep contraction in profitability:
- EBITDA declined by 27.9% year-on-year to ₹4,514 crore.
- Profit After Tax (PAT) slid by 27.1% year-on-year to ₹3,579 crore.
This sharp compression is the direct consequence of the massive regulatory changes implemented on February 1, 2026. The transition to a flat 40% GST coupled with steep increases in specific excise duties drastically expanded the sector’s aggregate tax incidence. Because cigarette sales traditionally provide 75% to 80% of ITC’s total bottom line, this compressed net margins severely before consumer retail prices could be adjusted to absorb the shock.
2. Strategic Levers for Investors to Watch
To determine whether this dip represents a permanent impairment of earnings power or a temporary friction point, institutional investors are closely monitoring the following internal indicators:
Capital Allocation & Structural Returns: Beyond the profit statement, looking at Return on Capital Employed (ROCE) and Return on Equity (ROE) is essential. With the demerger and standalone public listing of ITC Hotels Limited rolling through 2026, the removal of high capital-expenditure obligations from the parent company’s balance sheet will structurally optimize asset efficiency and cushion cash generation.
Calibrated Price Pass-Through: Management has historically chosen to space out retail price shocks across different stick lengths and price tiers rather than executing a massive one-time price spike. Investors need to watch if subsequent quarters show an incremental recovery in EBITDA margins as these pricing actions catch up with input costs.
Cigarette Volume Elasticity: The vital indicator is volume growth. If legal volumes decline sharply, it indicates consumers are migrating to India’s untaxed illicit cigarette market to avoid price hikes (a bear case scenario). If volumes remain flat or drop only slightly, it proves the elasticity of demand is highly resilient, clearing the path for an earnings recovery.
Risks to the ITC Share Price Target
1. Market Technicals vs. Fundamentals: The Block Deal Impact
The reference to the GQG-linked fund transaction underscores the critical difference between technical selling pressure and actual business health. The block deal involving the sale of nearly 37 crore shares at a floor price of ₹257.35 per share triggered sharp selling pressure, contributing to the stock hitting its 52-week low near ₹253.
While institutional liquidations of this size severely impact short-term technical indicators and sentiment, they do not reflect a change in the company’s long-term earnings power or product demand.
2. Core Regulatory & Market Risks
- Taxation and Illicit Trade Feedback Loop: Following the massive regulatory shift in February 2026—which moved the sector to a flat 40% GST and raised specific excise duties—ITC has been forced to implement retail price hikes of 25% to 35%. The key danger is that widening the price gap between legal, highly taxed cigarettes and contraband products directly accelerates consumer migration to India’s massive illicit tobacco market, permanently hurting legal volumes.
- FMCG Pricing and Margin Compression: While ITC’s “FMCG-Others” division continues to expand its top line, it faces intense competitive intensity from local and international consumer brands. Higher advertising spend combined with rising commodity costs (e.g., packaging materials and energy inputs) creates execution risk, where the division successfully expands its revenue footprint but struggles to improve net margins.
- Valuation Multiple De-rating: Even if ITC stabilizes its post-tax cigarette profits and grows its consumer revenue through 2030, it faces structural valuation hurdles. Increased regulatory mandates can cause large global funds to trim exposure to tobacco-linked assets, compressing the company’s Price-to-Earnings (P/E) multiple regardless of fundamental earnings growth.
Is ITC a Long-Term Growth Story?
1. The Core Paradox: Diversification vs. Bottom-Line Volatility
The fundamental premise of the “ITC Next” corporate playbook has been scaling its non-tobacco engines—specifically FMCG-Others (Aashirvaad, Sunfeast, Fiama) and Paperboards & Packaging—to cushion against severe regulatory intervention.
However, as highlighted by the Q1 FY2027 standalone performance, diversification does not automatically shield investors from sharp earnings shocks. Following the aggressive cigarette taxation overhaul implemented on February 1, 2026 (shifting the sector to a flat 40% GST plus updated excise duties), ITC’s consolidated Profit After Tax (PAT) slid 27.1% year-on-year to ₹3,579 crore. Because the tobacco channel generates approximately 75% to 80% of total corporate profits, a structural margin squeeze in cigarettes will dictate consolidated corporate outcomes despite excellent growth in food-service channels.
2. Deconstructing the “Value Trap” Risk
The analysis notes a vital rule of corporate finance: a lower share price alone does not establish that a stock is undervalued.
Following the tax shock and major technical pressure—including a massive block deal where a GQG-linked fund liquidated nearly 37 crore shares at a floor price of ₹257.35—the stock corrected heavily to trade near its 52-week floor around ₹253. At this price level, the market compresses ITC’s Price-to-Earnings (P/E) multiple to historical lows (around 17x forward earnings).
For this to be a genuine value opportunity rather than a value trap, the compressed multiple must be accompanied by visibility on an earnings recovery. If subsequent quarters show that staggered retail price hikes successfully restore per-stick margins without causing severe volume de-growth, the valuation multiple will naturally expand.
3. Key Operational Dashboards to Track
To determine if ITC can sustain its long-term growth trajectory through 2030, institutional investors look past the stock price chart to monitor six precise internal indicators:
Dividend Yield Integrity: Tracking if the firm’s free cash flow can comfortably sustain its strong payout baseline (which delivered ₹14.50 per share in FY26), serving as an institutional floor for the stock price.
Cigarette Volume Inelasticity: Modeling if legal volume trends stabilize, proving demand resilience against India’s massive untaxed illicit cigarette trade.
FMCG Margin Expansion: Assessing if operating leverage pushes the FMCG-Others segment EBITDA margins into the double-digits to support cash generation.
Asset Efficiency via Demergers: Monitoring the final regulatory steps of the ITC Hotels Limited standalone public listing, which optimizes corporate Return on Capital Employed (ROCE) by cutting out capital-intensive hospitality expenditure.
Frequently Asked Questions
1. What is ITC’s share price target for 2026?
The illustrative year-end targets are ₹240 in the bear case, ₹290 in the base case and ₹330 in the bull case. These are scenario-based estimates, not guaranteed outcomes.
2. What is ITC’s share price target for 2027?
The illustrative ITC share price target for 2027 is ₹240–₹370, with a base case of ₹310. The range depends on earnings recovery, business performance and valuation.
3. What is ITC’s share price target for 2030?
The illustrative 2030 range is ₹260–₹565, with a base case of ₹415. The higher scenarios require sustained earnings growth and favorable valuation assumptions.
4. What factors could affect ITC’s share price?
Cigarette taxation, pricing, cigarette volumes, FMCG growth, paper and packaging margins, input costs, cash flow, institutional transactions and overall market valuations could all affect the stock.
5. What valuation method is used for the ITC target?
The primary method is estimated earnings per share multiplied by an assumed P/E multiple. The scenarios use different EPS growth and valuation assumptions to represent alternative outcomes.
6. What are the major risks to the ITC target?
The main risks include higher cigarette taxes, lower volumes, weaker margins, competitive pressure, slower earnings growth, institutional selling and a reduction in the valuation multiple.
Source Quality Report
| Information | Source | Source type | Verification |
|---|---|---|---|
| FY2026 financial performance | ITC FY2026 official results | Primary | Verified |
| Q1 FY2027 financial performance | ITC Q1 FY2027 results | Primary | Verified |
| Share price reference | MarketWatch market report | Secondary | Reported closing price |
| Historical valuation | Morningstar valuation data | Secondary | Snapshot dated 1 October 2026 |
| Future share price targets | Calculations in this analysis | Scenario assumptions | Illustrative, not verified forecasts |
The source report does not establish an official ITC share price target. The forward EPS estimates and valuation multiples in this article are analytical assumptions, not company guidance or confirmed analyst consensus.
Disclaimer: These share price targets are scenario-based estimates for educational and informational purposes only. They are not guaranteed price predictions or investment advice. Actual prices may differ materially depending on earnings, valuation, market conditions and company-specific developments.
ITC Share Price History
Here is the formatted data table, perfect for a blog post. The rows are arranged chronologically starting from the most recent data point.
Stock Price Performance Data (Oct 2026)
| Date | Close Price | Open | High | Low | Volume | Change |
|---|---|---|---|---|---|---|
| 09-10-2026 | 266.00 | 255.45 | 268.05 | 255.10 | 31.03M | +4.31% |
| 08-10-2026 | 255.00 | 264.00 | 264.65 | 253.15 | 53.68M | -4.03% |
| 07-10-2026 | 265.70 | 265.70 | 267.15 | 262.45 | 50.03M | -0.37% |
| 06-10-2026 | 266.70 | 269.00 | 269.40 | 263.95 | 22.13M | -0.82% |
| 05-10-2026 | 268.90 | 260.95 | 269.80 | 259.00 | 49.02M | +5.08% |
| 01-10-2026 | 255.90 | 262.70 | 262.70 | 254.65 | 16.45M | -2.61% |
Stock Price Performance Data (Sept 2026)
| Date | Close Price | Open | High | Low | Volume | Change |
| 30-09-2026 | 262.75 | 265.00 | 266.90 | 261.40 | 14.08M | -0.89% |
| 29-09-2026 | 265.10 | 265.45 | 266.75 | 263.30 | 14.42M | -0.04% |
| 28-09-2026 | 265.20 | 269.00 | 269.30 | 265.00 | 7.86M | -1.41% |
| 25-09-2026 | 269.00 | 268.10 | 269.00 | 266.30 | 6.24M | +0.37% |
| 24-09-2026 | 268.00 | 268.70 | 270.30 | 266.70 | 7.40M | -0.80% |
| 23-09-2026 | 270.15 | 265.85 | 271.05 | 265.15 | 13.14M | +1.64% |
| 22-09-2026 | 265.80 | 267.90 | 268.25 | 264.75 | 7.18M | -0.45% |
| 21-09-2026 | 267.00 | 263.55 | 267.95 | 263.55 | 8.66M | +1.79% |
| 18-09-2026 | 262.30 | 266.60 | 266.60 | 262.30 | 14.40M | -1.47% |
| 17-09-2026 | 266.20 | 264.80 | 268.50 | 264.10 | 13.37M | +0.78% |
| 16-09-2026 | 264.15 | 259.40 | 264.90 | 259.30 | 15.20M | +2.38% |
| 15-09-2026 | 258.00 | 261.00 | 264.20 | 258.00 | 12.13M | -0.71% |
| 11-09-2026 | 259.85 | 258.00 | 261.65 | 257.70 | 11.12M | +0.21% |
| 10-09-2026 | 259.30 | 261.00 | 263.90 | 259.10 | 17.54M | -0.58% |
| 09-09-2026 | 260.80 | 263.65 | 264.50 | 260.20 | 10.07M | -1.02% |
| 08-09-2026 | 263.50 | 263.50 | 265.90 | 262.70 | 7.41M | 0.00% |
| 07-09-2026 | 263.50 | 264.10 | 264.95 | 262.95 | 6.69M | -0.23% |
| 04-09-2026 | 264.10 | 264.00 | 266.25 | 262.65 | 9.52M | +0.42% |
| 03-09-2026 | 263.00 | 266.50 | 267.60 | 262.35 | 17.81M | -1.24% |
| 02-09-2026 | 266.30 | 266.00 | 269.00 | 262.80 | 14.64M | -0.11% |
| 01-09-2026 | 266.60 | 261.50 | 268.20 | 261.50 | 31.26M | +4.34% |
Stock Price Performance Data (Aug 2026)
| Date | Close Price | Open | High | Low | Volume | Change |
| 31-08-2026 | 255.50 | 266.00 | 266.55 | 255.50 | 24.58M | -3.95% |
| 28-08-2026 | 266.00 | 269.00 | 269.00 | 264.80 | 15.20M | -1.12% |
| 27-08-2026 | 269.00 | 269.50 | 271.25 | 268.00 | 8.83M | -0.46% |
| 26-08-2026 | 270.25 | 271.85 | 273.95 | 270.25 | 11.69M | -0.42% |
| 25-08-2026 | 271.40 | 269.70 | 271.40 | 267.65 | 8.41M | +0.63% |
| 24-08-2026 | 269.70 | 270.60 | 270.60 | 267.00 | 8.52M | +0.11% |
| 21-08-2026 | 269.40 | 271.60 | 271.60 | 269.00 | 8.31M | -0.83% |
| 20-08-2026 | 271.65 | 268.20 | 271.65 | 265.00 | 28.27M | +1.72% |
| 19-08-2026 | 267.05 | 270.00 | 270.95 | 265.85 | 13.82M | -1.09% |
| 18-08-2026 | 270.00 | 273.05 | 273.65 | 269.15 | 14.56M | -1.12% |
| 17-08-2026 | 273.05 | 278.20 | 278.20 | 273.00 | 12.80M | -1.85% |
| 14-08-2026 | 278.20 | 278.35 | 278.35 | 275.95 | 7.34M | -0.11% |
| 13-08-2026 | 278.50 | 276.20 | 278.50 | 276.05 | 11.34M | +0.85% |
| 12-08-2026 | 276.15 | 279.00 | 279.55 | 275.40 | 12.63M | -1.02% |
| 11-08-2026 | 279.00 | 282.00 | 282.60 | 278.00 | 13.05M | -1.29% |
| 10-08-2026 | 282.65 | 286.10 | 286.10 | 281.40 | 9.35M | -1.21% |
| 07-08-2026 | 286.10 | 285.00 | 286.10 | 284.40 | 6.13M | +0.07% |
| 06-08-2026 | 285.90 | 285.45 | 286.35 | 283.70 | 12.45M | -0.37% |
| 05-08-2026 | 286.95 | 288.25 | 288.50 | 285.00 | 11.77M | -0.71% |
| 04-08-2026 | 289.00 | 286.05 | 289.00 | 284.70 | 12.69M | +0.70% |
| 03-08-2026 | 287.00 | 284.45 | 292.55 | 283.00 | 45.39M | +2.14% |
Stock Price Performance Data (July 2026)
| Date | Close Price | Open | High | Low | Volume | Change |
| 31-07-2026 | 281.00 | 285.55 | 285.80 | 280.05 | 16.83M | -1.42% |
| 30-07-2026 | 285.05 | 286.10 | 288.40 | 283.75 | 18.28M | -0.42% |
| 29-07-2026 | 286.25 | 285.60 | 289.05 | 284.15 | 19.03M | +0.56% |
| 28-07-2026 | 284.65 | 284.90 | 287.95 | 282.30 | 14.84M | -0.42% |
| 27-07-2026 | 285.85 | 287.75 | 287.90 | 285.50 | 19.31M | +0.85% |
| 24-07-2026 | 283.45 | 279.55 | 284.85 | 279.55 | 24.95M | +0.76% |
| 23-07-2026 | 281.30 | 279.95 | 284.00 | 279.65 | 21.14M | +0.18% |
| 22-07-2026 | 280.80 | 280.50 | 282.20 | 278.50 | 13.00M | -0.07% |
| 21-07-2026 | 281.00 | 283.00 | 283.95 | 278.80 | 9.86M | -0.60% |
| 20-07-2026 | 282.70 | 280.70 | 283.70 | 279.50 | 9.91M | +0.71% |
| 17-07-2026 | 280.70 | 279.35 | 281.95 | 277.80 | 15.22M | +0.48% |
| 16-07-2026 | 279.35 | 277.00 | 280.45 | 276.00 | 11.22M | +0.98% |
| 15-07-2026 | 276.65 | 276.65 | 277.70 | 275.30 | 8.52M | +0.40% |
| 14-07-2026 | 275.55 | 279.25 | 280.65 | 275.00 | 15.02M | -1.47% |
| 13-07-2026 | 279.65 | 281.35 | 281.50 | 279.50 | 12.56M | -0.75% |
| 10-07-2026 | 281.75 | 282.85 | 283.65 | 280.85 | 11.77M | -0.11% |
| 09-07-2026 | 282.05 | 281.25 | 284.40 | 281.00 | 12.51M | +0.50% |
| 08-07-2026 | 280.65 | 286.90 | 287.85 | 280.00 | 21.59M | -2.81% |
| 07-07-2026 | 288.75 | 288.30 | 290.70 | 286.55 | 18.49M | +0.17% |
| 06-07-2026 | 288.25 | 289.95 | 290.40 | 287.60 | 27.13M | -0.59% |
| 03-07-2026 | 289.95 | 291.30 | 291.60 | 289.00 | 6.52M | +0.02% |
| 02-07-2026 | 289.90 | 290.70 | 291.00 | 287.70 | 12.72M | -0.14% |
| 01-07-2026 | 290.30 | 287.85 | 291.00 | 287.10 | 6.55M | +1.17% |