
Table of Contents
1. Executive Growth Verdict
| Factor | Assessment |
|---|---|
| Growth outlook | 🟢 Strong turnaround / potentially high growth |
| Revenue CAGR – Bear | ~5% |
| Revenue CAGR – Base | 12–15% |
| Revenue CAGR – Bull | 18–22% |
| EBITDA CAGR – Base | 20%+ if margins normalize |
| PAT CAGR – Base | 18–25% from normalized earnings |
| EPS CAGR | Potentially 15–20%, but dilution is a major constraint |
| Growth visibility | Medium |
| Growth sustainability | Medium |
| 3–5 year growth score | 7.0/10 |
15 Small Cap Stocks FIIs Are Buying Below Industry P/E
My central conclusion (Gayatri Projects Growth Prospects)
Gayatri Projects is no longer primarily a turnaround-on-paper story. It is beginning to look like a turnaround-to-growth story — but the next 4–6 quarters are critical.
The most encouraging combination is:
Revenue recovery + return to profitability + balance-sheet repair + promoter/institutional participation + sharply higher FII ownership.
Q1 FY27 consolidated revenue from operations rose 198.7% YoY to ₹228.77 crore, while consolidated PAT turned positive at ₹37.12 crore, compared with a ₹0.58 crore loss in Q1 FY26. (ICICI Direct)
But there are still major caveats:
- the company recently emerged from a prolonged CIRP;
- FY26 reported PAT was massively distorted by exceptional items;
- the preferential issue caused substantial equity dilution;
- the company still needs to rebuild its order pipeline;
- cash-flow quality and receivable recoveries remain important;
- and the current FII jump partly reflects preferential allotment mechanics.
Therefore, I would classify Gayatri Projects today as:
🟢 PROMISING GROWTH — HIGH-RISK TURNAROUND
rather than a conventional high-conviction compounder.
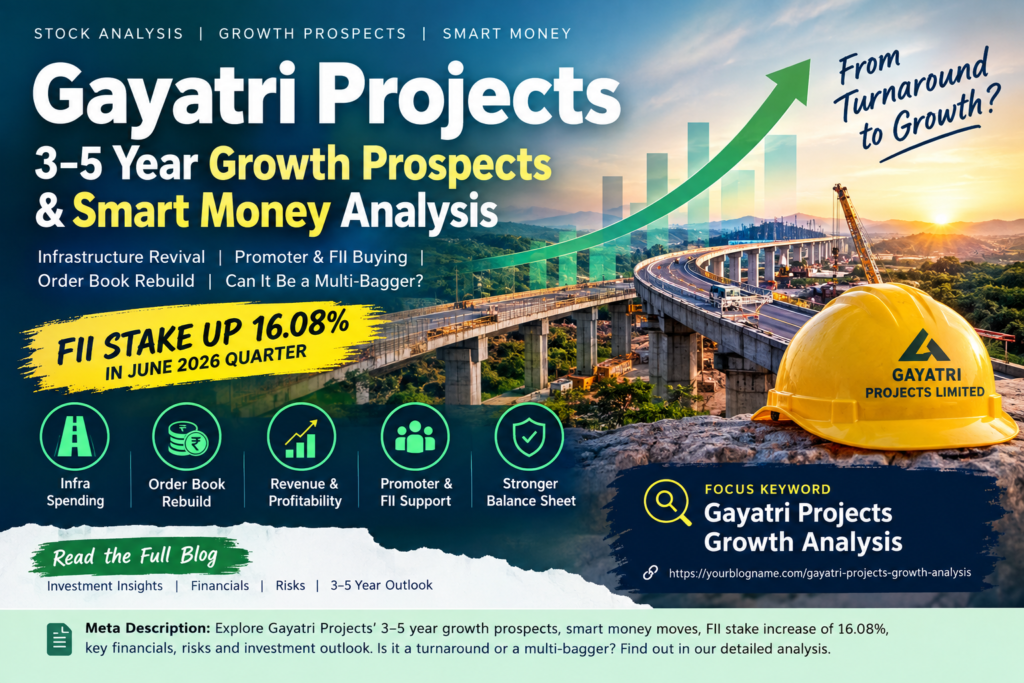
2. The Most Important Development: FII Ownership Jumped 16.08 Percentage Points
This deserves special attention.
FII/FPI ownership increased from:
1.91% → 17.99%
during the June 2026 quarter.
That is an increase of:
+16.08 percentage points
and represents roughly an 842% increase in the percentage holding relative to the previous 1.91% base.
Trendlyne also reports that the number of FII/FPI investors increased from 8 to 10, while total institutional ownership increased from 4.66% to 18.67%. (Trendlyne.com)
This is a very significant ownership change.
However, there is an important forensic qualification.
The FII increase coincided with the preferential issue
Gayatri Projects issued 27.71 crore new shares at ₹10 per share, raising ₹277.10 crore. The company’s share capital increased from 18.72 crore shares to 46.43 crore shares.
The preferential issue included institutional investors such as:
- Antara India Evergreen Fund
- M7 Global Fund PCC – Aerion
- Zeal Global Opportunities Fund
- Varanium India Opportunity Ltd.
The April 20 allotment alone included 3.5 crore shares for Antara, 50 lakh for M7 and 1.5 crore for Zeal.
The April 22 tranche included another 2.5 crore shares for Varanium India Opportunity Ltd. (NSE Archive)
Therefore:
I would not write:
“FIIs bought 16.08% from the open market.”
Instead, the more accurate investment interpretation is:
“FII/FPI ownership surged by 16.08 percentage points to 17.99% in the June 2026 quarter, partly reflecting participation by foreign funds in the company’s preferential capital raise.”
That’s actually more interesting.
It suggests that institutional investors were willing to provide fresh capital to a recently restructured infrastructure company at ₹10/share, while the company was simultaneously rebuilding operations.
That provides a degree of institutional validation, but it is not equivalent to sustained open-market accumulation.
3. Business Model & Growth Engine
Gayatri Projects is a diversified Indian EPC/infrastructure company operating across:
- Roads
- Irrigation
- Water distribution
- Mining
- Industrial construction
Its principal customers include government entities, NHAI, MoRTH and institutional/corporate clients. The company operates primarily through an EPC project-execution model.
Primary growth engines
| Growth engine | Importance |
|---|---|
| Infrastructure/EPC revival | ⭐⭐⭐⭐⭐ |
| Order-book rebuilding | ⭐⭐⭐⭐⭐ |
| Government infrastructure spending | ⭐⭐⭐⭐ |
| Improved project execution | ⭐⭐⭐⭐ |
| Lower legacy financial burden | ⭐⭐⭐⭐ |
| Operating leverage | ⭐⭐⭐⭐ |
| Institutional confidence | ⭐⭐⭐ |
The company itself says its future strategy is focused on strengthening EPC, rebuilding a sustainable order pipeline, improving project execution and maintaining financial discipline.
4. Historical Growth: The Numbers Need Context
The five-year picture looks terrible at first glance.
Standalone financial highlights
₹ crore
| FY | Revenue | PAT | EBITDA |
|---|---|---|---|
| FY21 | 3,900.5 | 56.6 | 449.1 |
| FY22 | 3,102.3 | -926.3 | -377.8 |
| FY23 | 1,017.2 | -1,426.1 | -656.3 |
| FY24 | 679.6 | -53.0 | 46.5 |
| FY25 | 449.9 | -68.8 | 2.5 |
| FY26 | 846.9 | 2,046.9 | 10.5 |
The annual report confirms the long-term deterioration and subsequent FY26 revenue recovery.
5-year revenue CAGR
FY21 → FY26:
approximately -35% CAGR
That clearly shows that Gayatri Projects has not historically been a compounder.
But this number is also misleading as a forward-looking indicator because the company underwent severe financial distress and CIRP.
The more relevant comparison is:
FY25 → FY26 revenue: +88.23%
Management specifically attributes the improvement to recovery in operations and execution across infrastructure/EPC projects.
5. The Real Earnings Turnaround
This is one of the strongest parts of the thesis.
FY26 reported PAT:
₹2,046.95 crore
looks extraordinary.
But almost all of the apparent profitability is not recurring operating profit.
The company itself explicitly says that the exceptional item had a significant impact on reported profit and that profit before exceptional items of ₹95.08 crore is a more meaningful indicator of underlying performance.
So I would ignore the ₹2,047 crore PAT when constructing a normal earnings model.
Normalized FY26 earnings
A better starting point is roughly:
₹95 crore pre-exceptional profit
rather than ₹2,047 crore PAT.
That dramatically changes the valuation and growth analysis.
6. Q1 FY27 Is the Most Important Signal
Q1 FY27:
| Metric | Q1 FY27 |
|---|---|
| Revenue from operations | ₹228.77 Cr |
| YoY growth | +198.7% |
| QoQ growth | +19.6% |
| Consolidated PAT | ₹37.12 Cr |
| Q1 FY26 PAT | -₹0.58 Cr |
| EPS | ₹2.36 |
This is a substantial operational improvement.
More importantly, the improvement is not solely a function of the FY26 exceptional gain.
The company generated approximately ₹40 crore of operating profit before depreciation and finance costs after removing other income from the calculation, implying an approximate 17.6% operating margin on Q1 revenue.
That is much more useful than looking at the headline PAT alone.
This is the key question:
Can Gayatri sustain something close to these operating economics for several quarters?
If yes, the company’s earnings power could be considerably higher than its historical FY24–25 numbers suggest.
7. Industry Growth
The industry backdrop is favorable.
The company’s FY26 annual report highlights continued Indian infrastructure spending across:
- highways
- expressways
- economic corridors
- logistics
- roads
- irrigation
- water infrastructure
- energy
NHAI constructed approximately 5,313 km of national highways in FY26, while NHAI capital expenditure was approximately ₹2.44 lakh crore.
The company’s own assessment is that infrastructure and road construction remain supported by sustained government investment.
But this is not enough by itself.
Gayatri needs to demonstrate:
industry growth → order wins → execution → revenue → EBITDA → cash flow
rather than merely benefiting from the infrastructure cycle.
8. Order Book: Biggest Missing Piece
This is one of the most important weaknesses in the current thesis.
Gayatri’s website historically highlighted a very large order book, but that information relates to March 2019, when the company stated an order book of ₹16,317 crore. It should not be treated as the current order book. (Gayatri Projects)
The FY26 annual report says management is now focused on rebuilding the business pipeline and strengthening the order book.
That means the company is effectively rebuilding its growth engine.
This is critical.
A ₹1,000 crore revenue company cannot sustain 15–20% growth for five years without sufficient executable orders.
Therefore:
The next major catalyst is not simply another profitable quarter. It is evidence that Gayatri is rebuilding a high-quality, executable order book.
9. Balance Sheet: Dramatic Improvement, But Not Yet Fortress Quality
This is where the turnaround becomes interesting.
The FY26 annual report reports:
- Current ratio: 1.55
- Debt/equity: 1.07
- DSCR: 3.43
- Positive net worth
- Completion of the OTS
- Exit from CIRP
The company states that the improvement reflects resolution of legacy financial obligations and completion of the OTS process.
Borrowings at March 2026 were around ₹619.85 crore standalone, versus over ₹4,013 crore at March 2025.
That is an enormous balance-sheet transformation.
However:
The company is not debt-free.
And infrastructure EPC requires working capital.
So the next stage is:
deleveraging → working-capital normalization → sustainable growth without recreating balance-sheet stress.
10. Preferential Issue: Positive and Negative
The company raised:
₹277.10 crore
through the preferential issue.
The money was fully utilized, with approximately:
- ₹145 crore toward OTS repayment
- ₹82.84 crore toward working capital
- ₹49.26 crore for general corporate purposes. (Whalesbook)
This is positive because capital was used to repair the balance sheet and fund operations.
But there was substantial dilution.
Shares increased from:
18.72 crore → 46.43 crore
That is approximately 148% growth in the share count.
This is extremely important for EPS investors.
Revenue and PAT can grow strongly while EPS growth remains much lower because of the enlarged equity base.
Therefore:
For Gayatri, EPS growth is more important than PAT growth.
11. FII + Promoter Signal
This is where the story becomes particularly interesting.
June 2026 ownership
| Category | Mar-26 | Jun-26 | Change |
|---|---|---|---|
| Promoters | 3.94% | 23.56% | +19.62 pp |
| FII | 1.91% | 17.99% | +16.08 pp |
| DII | 2.75% | 0.68% | -2.07 pp |
| Public | 91.41% | 57.76% | -33.65 pp |
(Screener)
This is an extraordinary restructuring of the shareholder base.
The bullish interpretation
Promoters and foreign institutions have collectively moved to approximately:
41.55% ownership
after the capital restructuring.
That is potentially a powerful alignment signal.
The cautious interpretation
A significant portion of this change resulted from preferential allotment, not necessarily open-market buying.
So I would score this:
Institutional accumulation: 8/10
but:
Quality of accumulation signal: 6.5/10
because the source of the ownership increase needs to be distinguished from normal market accumulation.
12. Earnings Quality
Score: 6/10
There has been genuine operational improvement, but earnings remain complicated.
Positive
- Revenue doubled approximately YoY in FY26.
- Q1 FY27 revenue increased almost 199%.
- Operating profitability improved.
- Balance-sheet restructuring has occurred.
- Legacy financial obligations have been addressed.
Negative
- FY26 PAT was dominated by exceptional items.
- Other income remains meaningful.
- Receivable recovery remains an issue.
- The company has significant historical accounting baggage.
- The share count increased dramatically.
The annual report specifically discusses a subcontractor receivable/ICL involving principal and accumulated interest, with recovery uncertainties.
This is exactly the type of issue a forensic investor should monitor.
13. Cash Flow Quality
This is one of the most important areas to watch.
FY26 operating cash flow improved materially, but a significant portion of the company’s financial recovery also involves:
- asset sales
- resolution of legacy obligations
- working-capital movements
- recovery of receivables
- exceptional items
The FY26 cash-flow statement shows substantial investing cash inflows, including proceeds from asset sales.
Therefore:
The next phase of the thesis requires recurring CFO.
I want to see:
CFO > PAT over a multi-year period
or at least strong CFO/PAT conversion.
Until that happens, I would not assign Gayatri the same quality rating as a clean-balance-sheet EPC compounder.
14. Contingent Liability Risk
Another important issue.
At March 2026, the company disclosed approximately:
₹624 crore
of bank guarantees/performance and contractual commitments.
For an EPC company this is not automatically alarming because bank guarantees are normal.
But the key is:
Can these guarantees be supported without creating new liquidity stress?
That should be monitored every quarter.
15. Management’s New Strategy
Management’s stated strategy is quite sensible:
- Strengthen EPC
- Rebuild the order pipeline
- Improve execution
- Improve working capital
- Maintain financial discipline
- Pursue selective rather than aggressive growth
I actually prefer this approach to a highly aggressive post-CIRP expansion.
The company’s biggest historical problem was not lack of ambition.
It was financial stress combined with execution and working-capital problems.
Therefore, controlled growth is preferable.
16. 3–5 Year Scenario Model
I would use normalized FY26 operating earnings, not the ₹2,047 crore reported PAT, as the starting point.
Bear Case
Assumptions:
- Order-book rebuilding is slow
- Revenue CAGR ~5%
- Margins remain weak
- Working capital remains demanding
- No meaningful operating leverage
Possible FY31:
| Metric | Bear FY31 |
|---|---|
| Revenue | ₹1,080–1,100 Cr |
| EBITDA | ₹65–75 Cr |
| PAT | ₹45–55 Cr |
| EPS | ~₹1.0–1.2 |
Base Case
Assumptions:
- Revenue CAGR ~12–15%
- Successful order-book rebuilding
- EBITDA margin gradually reaches ~8–10%
- Better working-capital management
- No major balance-sheet setback
- Moderate operating leverage
Potential FY31:
| Metric | Base FY31 |
|---|---|
| Revenue | ₹1,500–1,700 Cr |
| EBITDA | ₹130–165 Cr |
| PAT | ₹90–120 Cr |
| EPS | ~₹2.0–2.6 |
This would represent a genuine recovery but not yet a spectacular compounder.
Bull Case
Assumptions:
- Revenue CAGR 18–22%
- Strong government EPC cycle
- Significant new orders
- Better asset utilization
- EBITDA margin reaches 10–12%
- Working capital improves substantially
- No fresh dilution
Potential FY31:
| Metric | Bull FY31 |
|---|---|
| Revenue | ₹1,900–2,300 Cr |
| EBITDA | ₹200–270 Cr |
| PAT | ₹140–190 Cr |
| EPS | ~₹3.0–4.1 |
The bull case is where the current institutional participation becomes particularly interesting.
17. Can Revenue Grow >15% for 3–5 Years?
My answer: Possible, but not yet proven.
The company has demonstrated:
88% FY26 revenue growth
and:
199% Q1 FY27 YoY revenue growth.
But these are recovery numbers.
The difficult part is maintaining 15%+ CAGR after the turnaround base effect disappears.
The company must demonstrate:
Order wins → execution → revenue visibility.
I would upgrade the probability of >15% sustainable growth significantly if Gayatri can show:
₹1,500–2,000+ crore of credible executable order book with healthy margins.
18. Can PAT Grow Faster Than Revenue?
Yes — potentially.
This is actually one of the most attractive aspects.
Gayatri currently has significant operating leverage.
If revenue grows 15% while EBITDA margins expand from ~5–6% toward 9–10%, PAT can grow considerably faster than revenue.
But this requires:
- low incremental interest burden
- disciplined working capital
- no major exceptional losses
- controlled overheads
- consistent execution
19. Can EPS Compound >15%?
Possible, but this is the biggest question mark.
Why?
Because of the enormous share-count increase.
The company has gone from roughly:
18.72 crore shares → 46.43 crore shares.
Therefore, investors should not get excited simply because:
“PAT is growing 30%.”
The question is:
“Is PAT growing faster than the 148% increase in the equity base?”
Going forward, further equity dilution would materially weaken the thesis.
20. Valuation
The stock was around ₹25.93–₹26.04 on 11 September 2026, with market capitalization around ₹1,200 crore. (mint)
Traditional P/E figures are currently extremely distorted because of the FY26 exceptional profit.
Some data providers show a sub-1x P/E because they use the huge reported FY26 earnings, while other normalized-data providers show approximately 8–9x based on recurring/TTM-type earnings. (IFIN)
My view:
Do not use the headline P/E.
Instead, value Gayatri on:
normalized PAT + normalized EPS + EV/EBITDA + future cash flow.
At approximately ₹1,200 crore market cap, the valuation does not look demanding if the company can sustainably produce ₹100–150 crore of normalized annual PAT.
But if earnings fall back toward ₹40–50 crore, the apparent cheapness disappears quickly.
21. Growth Inflection Points
| Catalyst | Impact | Probability | Time |
|---|---|---|---|
| Sustained Q1-style execution | High | High | 0–12m |
| New order wins | Very High | Medium | 0–18m |
| Order book rebuild | Very High | Medium | 1–2y |
| Margin expansion | High | Medium-High | 1–3y |
| Working-capital normalization | High | Medium | 1–3y |
| Further debt reduction | High | Medium | 1–3y |
| FII ownership staying near 18%+ | Medium-High | Medium | 0–3y |
| Promoter ownership stability | High | Medium-High | 0–3y |
| No further major dilution | Very High | Medium | 0–5y |
| Strong infrastructure spending | High | High | 3–5y |
22. Biggest Risks
1. Order-book risk
The company needs to rebuild its executable order book.
2. Working-capital risk
EPC growth can consume enormous amounts of working capital.
3. Receivable risk
Historical receivable/subcontractor issues remain relevant.
4. Dilution risk
The equity base has already expanded dramatically.
5. Balance-sheet relapse
The company has only recently emerged from severe financial stress.
6. Execution risk
Winning orders is not enough.
7. Margin risk
Construction inflation can destroy EPC margins.
8. Exceptional-item risk
Investors could mistake one-off gains/losses for sustainable earnings.
9. Institutional-ownership interpretation risk
The 16.08-point FII increase is encouraging, but partly linked to preferential issuance.
10. Governance/capital-allocation risk
The post-CIRP phase needs to establish a consistent record of disciplined capital allocation.
23. What Would Make Me More Bullish?
I would materially upgrade the stock if the next 4–6 quarters show:
1. Revenue consistently above ₹250–300 crore per quarter
2. EBITDA margin consistently above 8–10%
3. PAT consistently above ₹25–30 crore per quarter
4. Strong positive operating cash flow
5. Order book rebuilding substantially
6. No fresh equity dilution
7. FII ownership remains around 18% or increases through genuine market accumulation
8. Promoter ownership remains stable/increases without excessive pledging
9. Debt continues falling
10. Receivables convert into cash
If these happen together, the market could begin treating Gayatri as a re-rated infrastructure revival story rather than an ex-insolvency company.
24. What Would Make Me Bearish?
I would become significantly more cautious if:
- quarterly revenue falls below ₹200 crore for several quarters;
- EBITDA margin falls below 5%;
- CFO repeatedly remains below PAT;
- receivables increase sharply;
- debt starts increasing again;
- additional equity is issued;
- promoter pledge increases materially;
- FII ownership falls sharply;
- order wins remain weak;
- or exceptional gains continue masking weak operating earnings.
25. Final Growth Scorecard
| Factor | Score /10 |
|---|---|
| Industry growth | 8.5 |
| TAM/runway | 8.0 |
| Revenue growth | 8.0 |
| Earnings growth | 8.0 |
| Margin potential | 7.5 |
| Market-share potential | 6.5 |
| Competitive advantage | 6.5 |
| Capacity expansion | 6.0 |
| Order/revenue visibility | 5.5 |
| Cash-flow quality | 5.5 |
| Balance sheet | 7.0 |
| Management execution | 6.5 |
| Capital allocation | 6.0 |
| Institutional accumulation | 8.0 |
| Valuation | 8.0 |
| Overall growth prospects | 7.0/10 |
26. Final Verdict
1. Can revenue grow >15% CAGR for 3–5 years?
Potentially yes, but not yet proven.
2. Can PAT grow faster than revenue?
Yes. Operating leverage creates that possibility.
3. Can EPS compound >15%?
Possible, but dilution makes this much harder than PAT growth.
4. Is growth internally funded?
Not fully proven yet. Working-capital requirements remain important.
5. Is the company gaining market share?
Too early to say. It is rebuilding rather than clearly demonstrating market-share gains.
6. Does it have a long growth runway?
Yes. Indian infrastructure spending provides a substantial runway.
7. Are there identifiable growth catalysts?
Yes — particularly order-book rebuilding, execution recovery, margin normalization and balance-sheet strengthening.
8. Is management credible?
Improving, but it needs to establish a multi-year post-CIRP execution record.
9. Is current valuation justified?
Yes, provided normalized earnings continue improving.
10. Single strongest reason to own the stock?
The combination of operational recovery + balance-sheet repair + substantial institutional participation.
The most interesting signal is that FII/FPI ownership went from 1.91% to 17.99%, a 16.08-percentage-point jump, while promoter ownership also increased sharply. (Trendlyne.com)
11. Single biggest reason NOT to own it?
The company has not yet proved that the post-CIRP turnaround can become a durable, cash-generating growth cycle.
The Bottom Line
I would not describe Gayatri Projects as a conventional “quality compounder” today.
I would describe it as:
🟢 PROMISING GROWTH — HIGH-RISK TURNAROUND
The investment thesis is essentially:
CIRP exit → debt restructuring → capital infusion → promoter re-entry → FII participation → revenue recovery → margin normalization → order-book rebuilding → potential earnings compounding.
The 16.08-percentage-point FII increase is one of the most interesting pieces of the puzzle, but I would not blindly label it “smart-money accumulation” because much of the increase appears connected to the preferential issue.
The real confirmation signal will be whether those institutions remain invested while Gayatri delivers 4–6 consecutive quarters of revenue growth, healthy EBITDA margins and genuine operating cash flow.
That is the point at which the story could transition from a turnaround trade into a genuine small-cap growth thesis.
Overall 3–5 year growth score: 7/10.
Risk level: Very High.
Growth potential: High.
Evidence of sustainable compounding: Not yet sufficient — but improving rapidly.