

Table of Contents
Sunil Singhania Portfolio Update
| Stock | June 2023 Change (%) |
| Dynamatic Technologies Ltd | 0.1% |
| HIL Ld | 0.07% |
| IIFL Securiies Ltd | 0.04% |
| ADF Foods Ltd | 0.03% |
| Sarda Energy & Minerals Ltd | 0.01% |
As per data by Trendlyne,
Institutional Investors have increased holdings from 26.79% to 27.09% in Jun 2023 quarter (as per data by Trendlyne) in Dynamatic Technologies Ltd.
In ADF Foods too, Institutional Investors have increased holdings from 29.15% to 29.35% in Jun 2023 quarter.
Same is the case with Sarda Energy & Minerals Ltd. Institutional Investors have increased holdings from 6.20% to 6.31% in Jun 2023 qtr.
Dynamatic Technologies (Sunil Singhania Portfolio ) Quarterly Results
Net Sales
| Jun ’22 (Rs Cr) | Sep ’22 (Rs Cr) | Dec ’22 (Rs Cr) | Mar ’23 (Rs Cr) | Jun ’23 (Rs Cr) |
| 310.96 | 323.72 | 313.21 | 367.88 | 362.1 |
Company witnessed a 16.44% growth in net sales YoY but QoQ the number remained almost flat.
EBITDA
| Jun ’22 (Rs Cr) | Sep ’22 (Rs Cr) | Dec ’22 (Rs Cr) | Mar ’23 (Rs Cr) | Jun ’23 (Rs Cr) |
| 42.28 | 47.7 | 41.95 | 49.46 | 37 |
YoY Ebitda registered a decline of 12.48%. QoQ the decline was 25.19%.
Net Profit
| Jun ’22 (Rs Cr) | Sep ’22 (Rs Cr) | Dec ’22 (Rs Cr) | Mar ’23 (Rs Cr) | Jun ’23 (Rs Cr) |
| 8.17 | 10.04 | 7.02 | 17.56 | 41.36 |
Despite being negative on the EBITDA front , net profit of the company has risen 406% YoY. QoQ, the growth in net profits is almost 135%.
Dynamatic Technologies Shareholding Pattern
| Dec 2021 | Mar 2022 | Jun 2022 | Sep 2022 | Dec 2022 | Mar 2023 | Jun 2023 | |
| FII | 10.78 | 10.88 | 11.03 | 11.09 | 11.31 | 16.76 | 16.59 |
| DII | 6.84 | 9.71 | 9.56 | 10.03 | 10.50 |
FIIs have been increasing their shareholding in the company since Dec 2021 .
| Fund | Change in positions in July 2023 |
| HDFC Balanced Advantaged Fund | 5.02% |
| HDFC Infrastructure Fund | 5.02% |
| HDFC Defence Fund | 5.02% |
DIIs have also been adding to their positions in the company.
Moreover, retail holding in the company has been on a downward spiral for quite some time now which implies that stock is getting more and more in the strong hands.
Dynamatic Technologies Breakout Levels
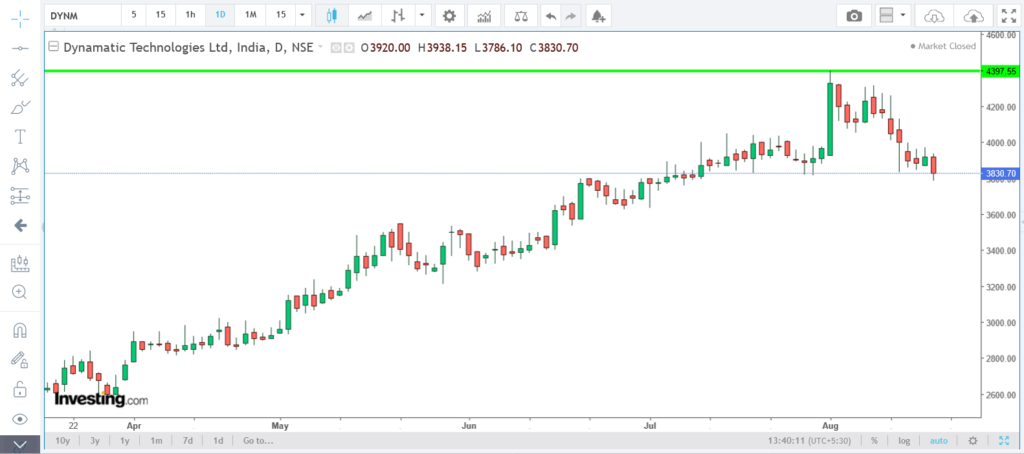
Breakout for us would be above Rs 4400 stop loss would be the low of the candle previous to the breakout candle.
HIL (Sunil Singhania Portfolio ) Quarterly Results
Net Sales
| Jun ’22 (Rs Cr) | Sep ’22 (Rs Cr) | Dec ’22 (Rs Cr) | Mar ’23 (Rs Cr) | Jun ’23 (Rs Cr) |
| 1084.65 | 763.87 | 767.17 | 863.27 | 1015.50 |
Although there is a 6.37% decline in net sales YoY, company has delivered an impressive 117% growth in revenues QoQ.
EBITDA
| Jun ’22 (Rs Cr) | Sep ’22 (Rs Cr) | Dec ’22 (Rs Cr) | Mar ’23 (Rs Cr) | Jun ’23 (Rs Cr) |
| 122.79 | 12.02 | 50.42 | 37.69 | 87.20 |
YoY EBITDA has seen a decline of 29%. QoQ, the growth in EBITDA is 231%.
Net Profit
| Jun ’22 (Rs Cr) | Sep ’22 (Rs Cr) | Dec ’22 (Rs Cr) | Mar ’23 (Rs Cr) | Jun ’23 (Rs Cr) |
| 86.46 | -6.30 | 13.32 | 4.82 | 58.50 |
There is a decline of about 32% in net profits YoY, there is a growth of 1213% QoQ.
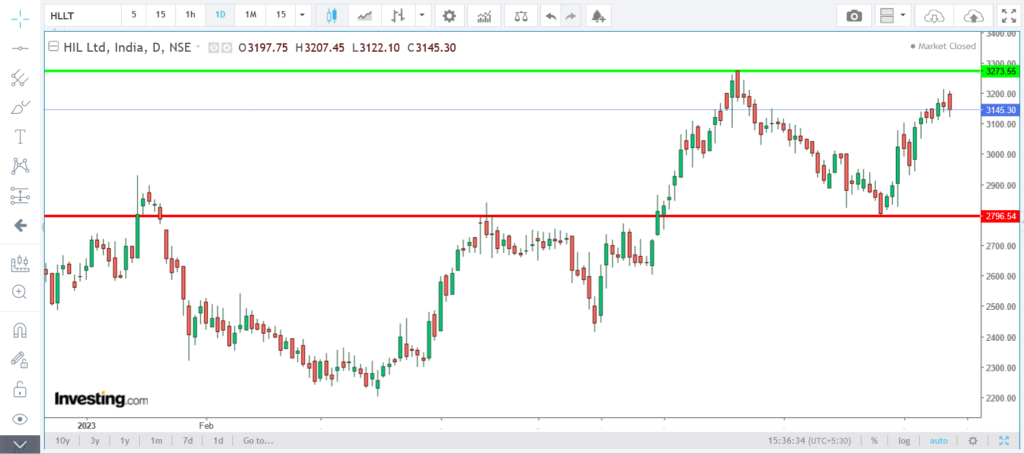
Breakout for us would be above Rs. 3275 and stop loss would be the low of the candle previous to the breakout candle.
1 thought on “5 Stocks Sunil Singhania Bought This Quarter | Sunil Singhania Portolio”